Markets
The latest markets news and analysis from JournalArta Global.
Live prices & market news: Markets overview · Stocks · Crypto · Forex · Commodities
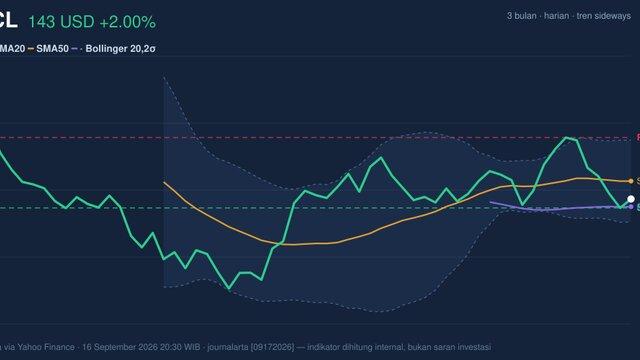
ORCL Stock Technicals Today: Gains 2.00%, Momentum Weakens
On September 17, 2026: price 143.16 USD, trend sideways, RSI 45.3, support 140.35, resistance 162.52. technical analysis of orcl stock.
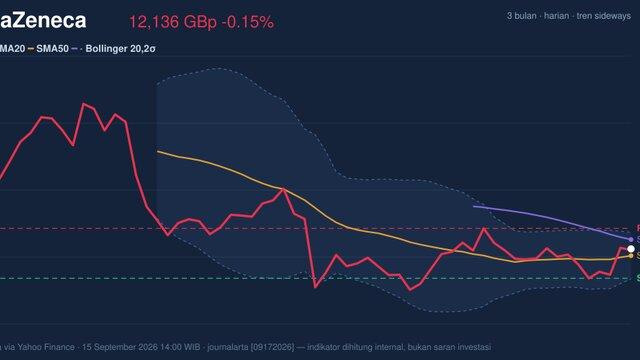
AstraZeneca Stock Drops 0.15%, Momentum Gains In Focus
On September 17, 2026: price 12,136.00 GBp, trend sideways, RSI 51.4, support 11,650.00, resistance 12,476.00. technical analysis of astrazeneca stock.
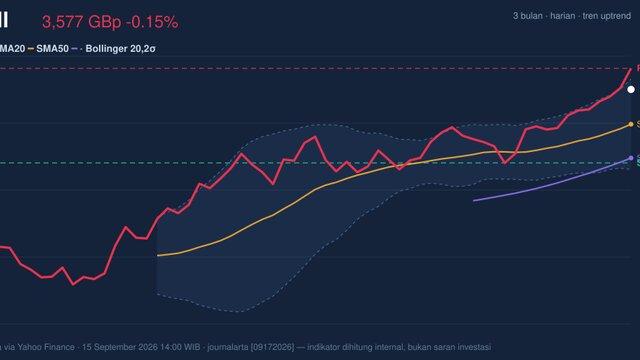
RSI Overbought, Shell Stock Drops 0.15% Today
On September 17, 2026: price 3,576.50 GBp, trend uptrend, RSI 76.5, support 3,311.00, resistance 3,652.50. technical analysis of shell stock.
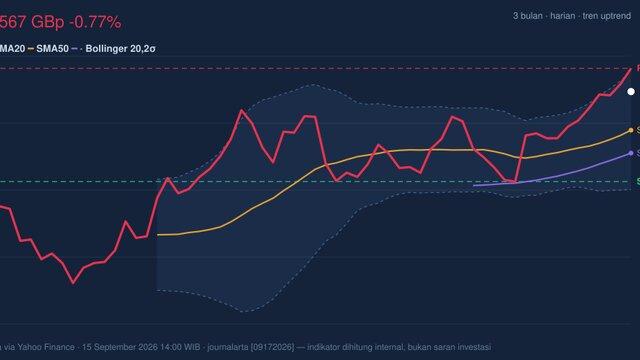
BP RSI Overbought: Stock Drops 0.77% (September 17, 2026)
On September 17, 2026: price 566.80 GBp, trend uptrend, RSI 70.3, support 514.50, resistance 580.30. technical analysis of bp stock.
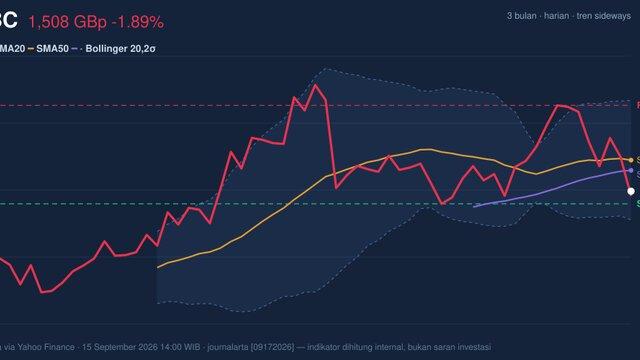
HSBC Stock Drops 1.89%, Testing Support Level In Focus
On September 17, 2026: price 1,507.80 GBp, trend sideways, RSI 42.7, support 1,497.20, resistance 1,580.20. technical analysis of hsbc stock.
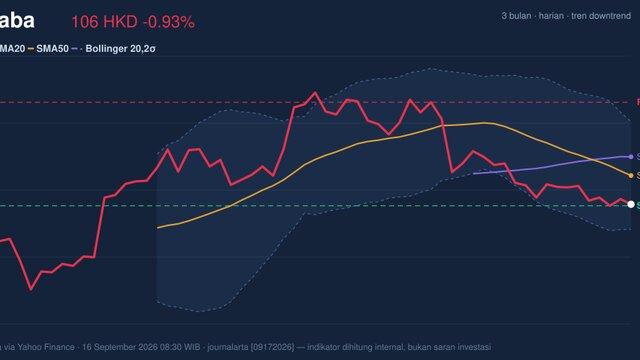
Alibaba Death Cross Pressure: Stock Drops 0.93% (September 17, 2026)
On September 17, 2026: price 106.20 HKD, trend downtrend, RSI 37.7, support 105.90, resistance 126.20. technical analysis of alibaba stock.
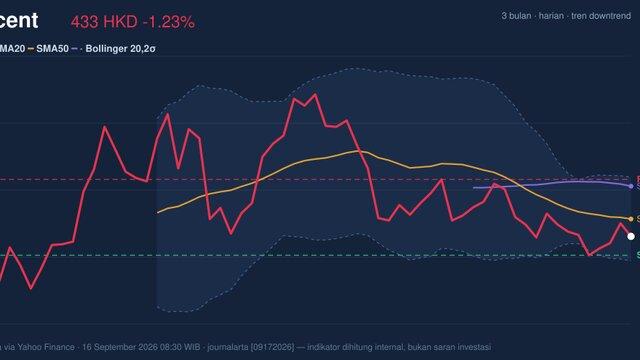
Tencent Stock Drops 1.23% Today, Momentum Weakens
On September 17, 2026: price 433.40 HKD, trend downtrend, RSI 43.9, support 425.60, resistance 457.00. technical analysis of tencent stock.
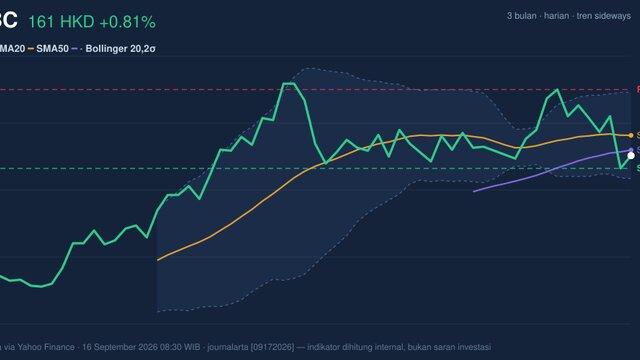
HSBC Stock Gains 0.81%, Testing Support Level In Focus
On September 17, 2026: price 160.90 HKD, trend sideways, RSI 46.4, support 159.60, resistance 167.60. technical analysis of hsbc stock.
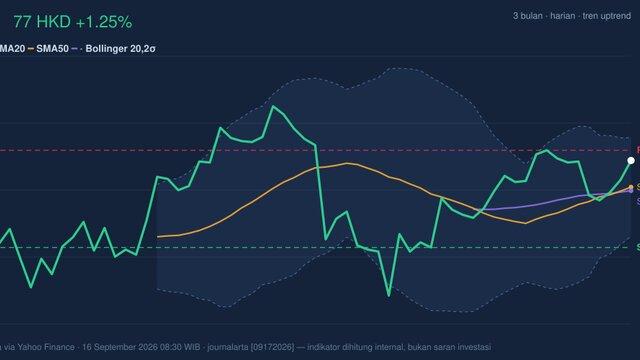
Golden Cross Formed, AIA Stock Gains 1.25% Today
On September 17, 2026: price 77.00 HKD, trend uptrend, RSI 57.3, support 72.75, resistance 77.50. technical analysis of aia stock.
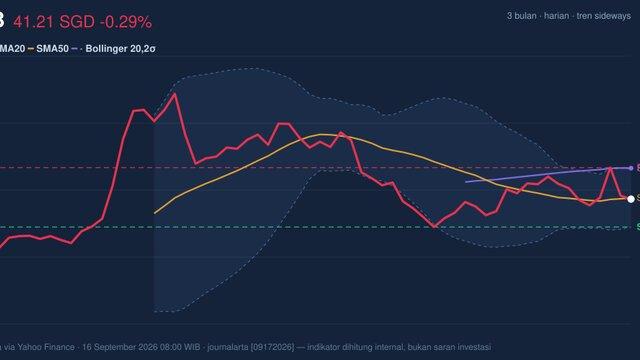
UOB Stock Drops 0.29% Today, Momentum Gains
On September 17, 2026: price 41.21 SGD, trend sideways, RSI 46.7, support 40.22, resistance 42.33. technical analysis of uob stock.
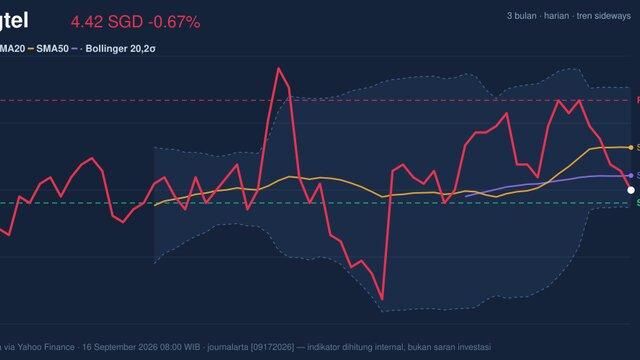
Testing Support Level, Singtel Stock Drops 0.67% Today
On September 17, 2026: price 4.42 SGD, trend sideways, RSI 44.6, support 4.40, resistance 4.56. technical analysis of singtel stock.
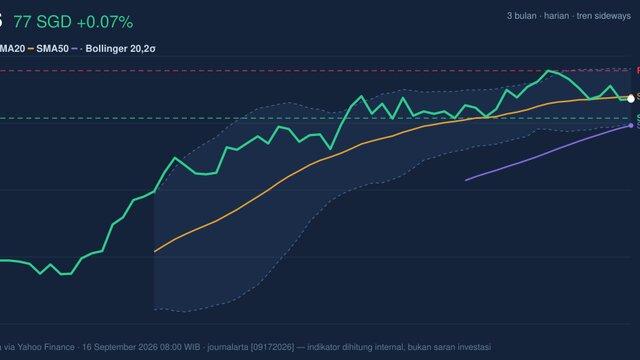
DBS Stock Analysis: Gains 0.07%, Momentum Weakens
On September 17, 2026: price 76.80 SGD, trend sideways, RSI 53.0, support 75.56, resistance 78.65. technical analysis of dbs stock.
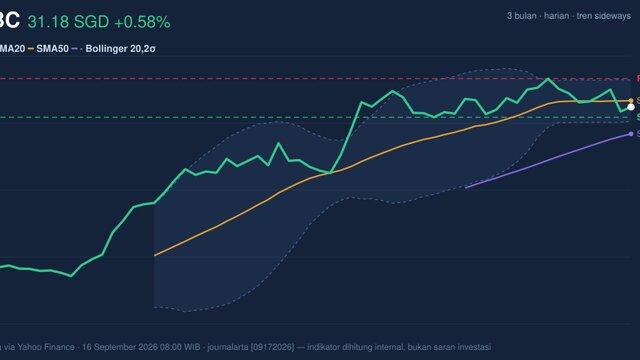
OCBC Stock Analysis: Gains 0.58%, Testing Support Level
On September 17, 2026: price 31.18 SGD, trend sideways, RSI 52.2, support 30.78, resistance 32.27. technical analysis of ocbc stock.
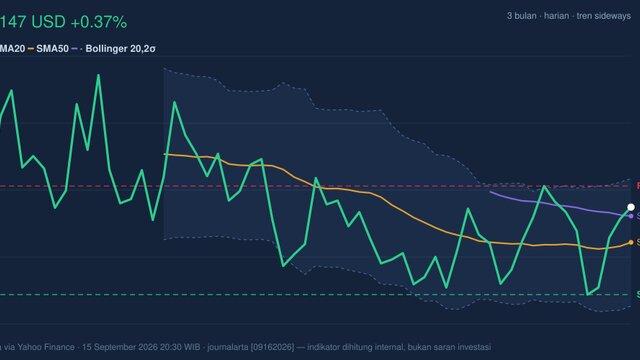
Testing Key Resistance, PG Stock Gains 0.37% Today
On September 16, 2026: price 146.67 USD, trend sideways, RSI 53.6, support 142.64, resistance 147.64. technical analysis of pg stock.
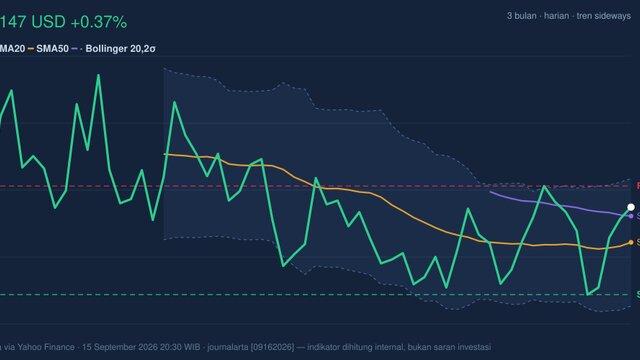
Testing Key Resistance, PG Stock Gains 0.37% Today
On September 16, 2026: price 146.67 USD, trend sideways, RSI 53.6, support 142.64, resistance 147.64. technical analysis of pg stock.
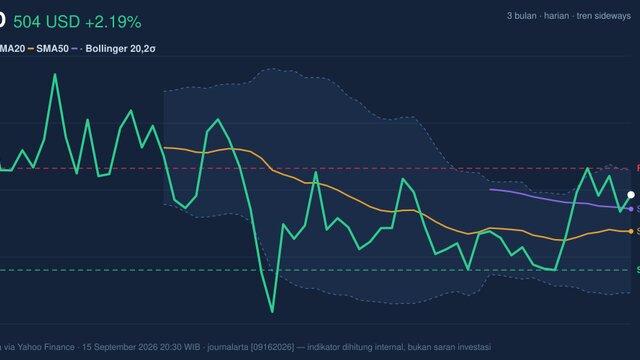
Momentum Gains, AMD Stock Gains 2.19% Today
On September 16, 2026: price 504.20 USD, trend sideways, RSI 54.2, support 456.16, resistance 521.10. technical analysis of amd stock.
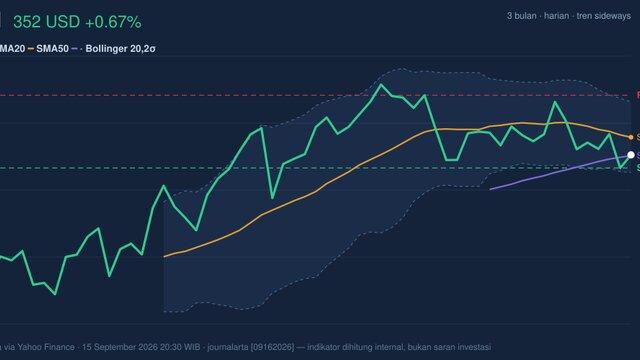
JPM Stock Gains 0.67%, Testing Support Level In Focus
On September 16, 2026: price 352.49 USD, trend sideways, RSI 47.2, support 350.13, resistance 363.25. technical analysis of jpm stock.
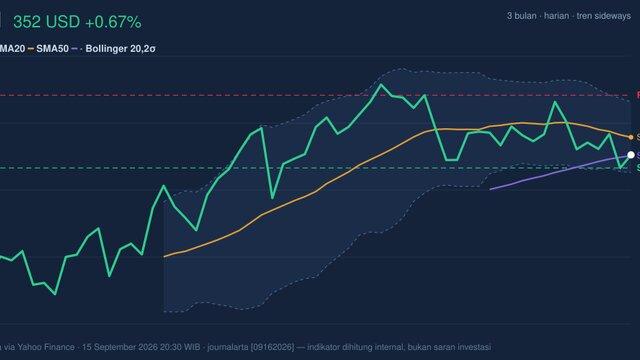
JPM Stock Gains 0.67%, Testing Support Level In Focus
On September 16, 2026: price 352.49 USD, trend sideways, RSI 47.2, support 350.13, resistance 363.25. technical analysis of jpm stock.
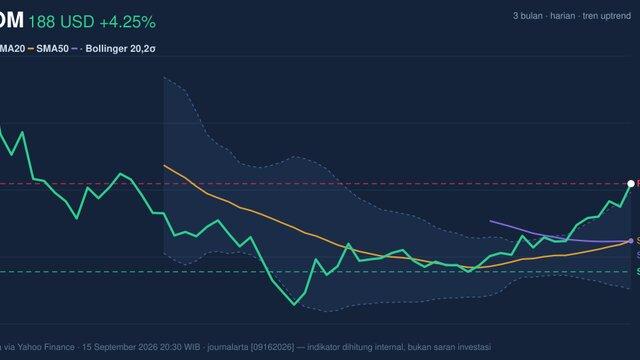
QCOM Stock Technicals Today: Gains 4.25%, Golden Cross Formed
On September 16, 2026: price 187.80 USD, trend uptrend, RSI 69.2, support 158.53, resistance 187.80. technical analysis of qcom stock.
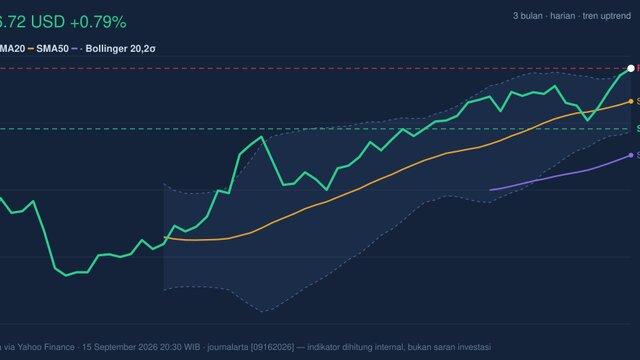
Testing Key Resistance, T Stock Gains 0.79% Today
On September 16, 2026: price 26.72 USD, trend uptrend, RSI 67.2, support 24.90, resistance 26.72. technical analysis of t stock.
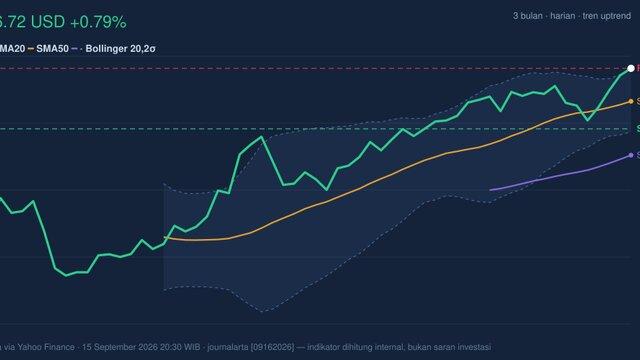
Testing Key Resistance, T Stock Gains 0.79% Today
On September 16, 2026: price 26.72 USD, trend uptrend, RSI 67.2, support 24.90, resistance 26.72. technical analysis of t stock.
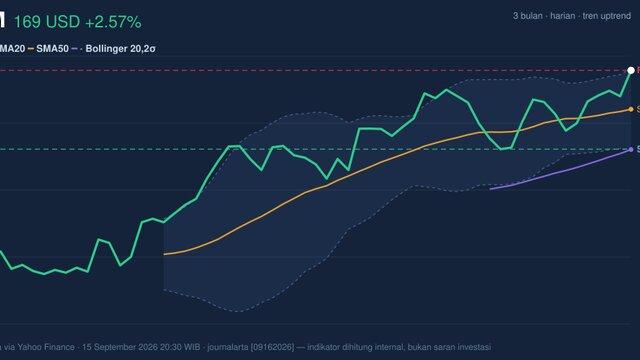
XOM Stock Gains 2.57%, Testing Key Resistance In Focus
On September 16, 2026: price 169.32 USD, trend uptrend, RSI 65.6, support 156.44, resistance 169.32. technical analysis of xom stock.
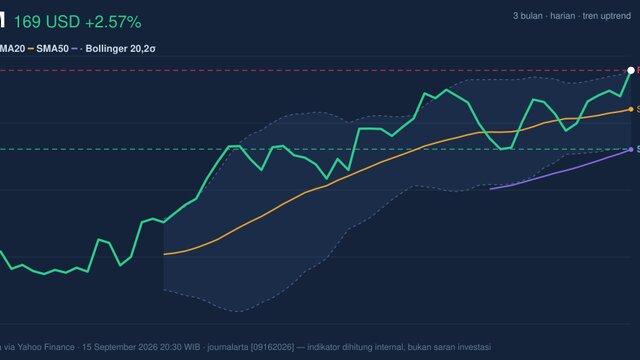
XOM Stock Gains 2.57%, Testing Key Resistance In Focus
On September 16, 2026: price 169.32 USD, trend uptrend, RSI 65.6, support 156.44, resistance 169.32. technical analysis of xom stock.
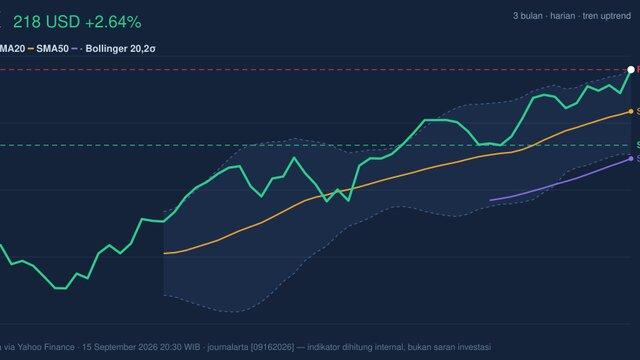
CVX RSI Overbought: Stock Gains 2.64% (September 16, 2026)
On September 16, 2026: price 217.77 USD, trend uptrend, RSI 70.5, support 199.77, resistance 217.77. technical analysis of cvx stock.