Markets
The latest markets news and analysis from JournalArta Global.
Live prices & market news: Markets overview · Stocks · Crypto · Forex · Commodities
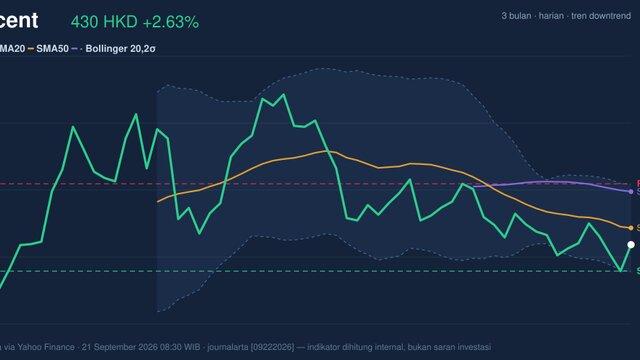
Tencent Stock Technicals Today: Gains 2.63%, Momentum Weakens
On September 22, 2026: price 430.00 HKD, trend downtrend, RSI 44.7, support 419.00, resistance 455.20. technical analysis of tencent stock.
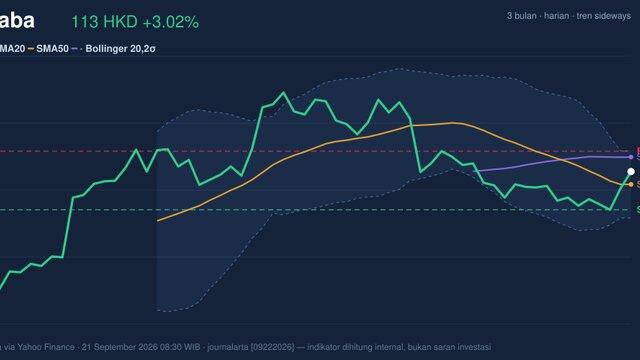
Alibaba Stock Gains 3.02% Today, Momentum Gains
On September 22, 2026: price 112.60 HKD, trend sideways, RSI 52.1, support 105.10, resistance 116.60. technical analysis of alibaba stock.
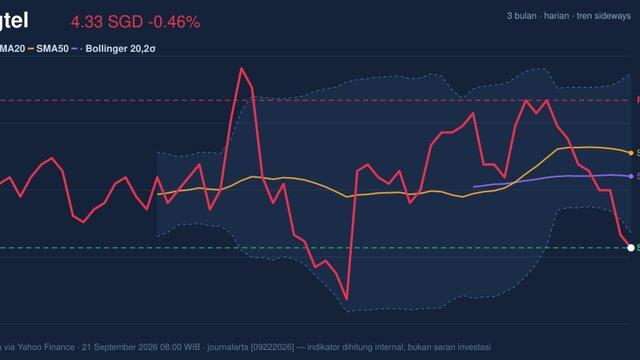
Singtel Stock Drops 0.46%, Testing Support Level In Focus
On September 22, 2026: price 4.33 SGD, trend sideways, RSI 36.1, support 4.33, resistance 4.56. technical analysis of singtel stock.
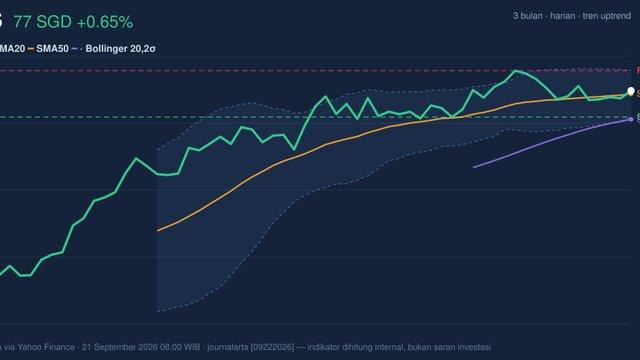
DBS Momentum Weakens: Stock Gains 0.65% (September 22, 2026)
On September 22, 2026: price 77.36 SGD, trend uptrend, RSI 56.4, support 75.65, resistance 78.65. technical analysis of dbs stock.
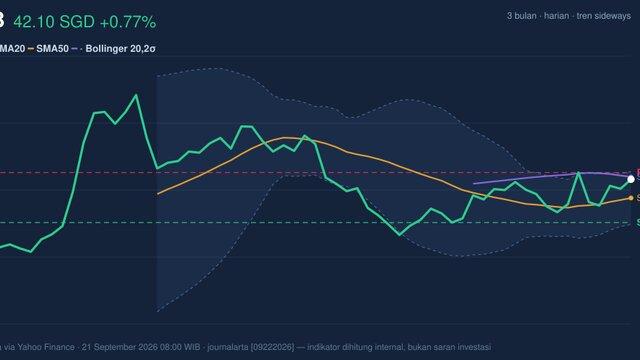
UOB Stock Technicals Today: Gains 0.77%, Testing Key Resistance
On September 22, 2026: price 42.10 SGD, trend sideways, RSI 55.0, support 40.64, resistance 42.33. technical analysis of uob stock.
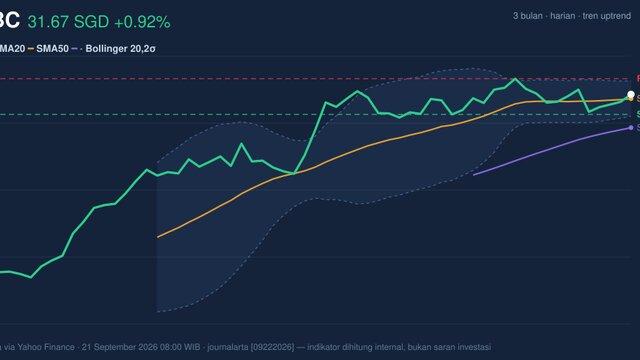
OCBC Momentum Weakens: Stock Gains 0.92% (September 22, 2026)
On September 22, 2026: price 31.67 SGD, trend uptrend, RSI 57.8, support 30.90, resistance 32.27. technical analysis of ocbc stock.
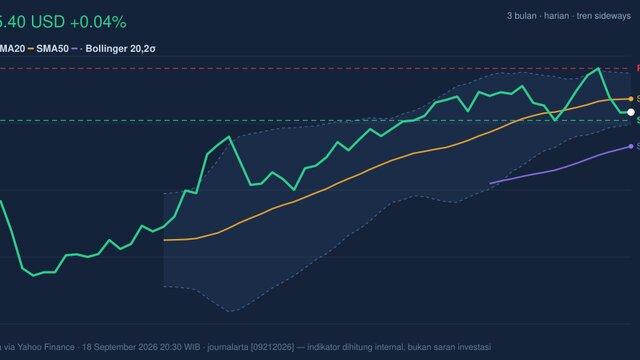
T Stock Gains 0.04%, Testing Support Level In Focus
On September 21, 2026: price 25.40 USD, trend sideways, RSI 50.4, support 25.15, resistance 26.72. technical analysis of t stock.
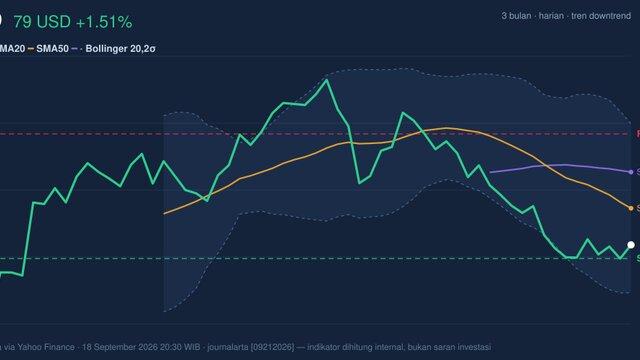
PDD Momentum Weakens: Stock Gains 1.51% (September 21, 2026)
On September 21, 2026: price 78.90 USD, trend downtrend, RSI 39.5, support 77.73, resistance 88.38. technical analysis of pdd stock.
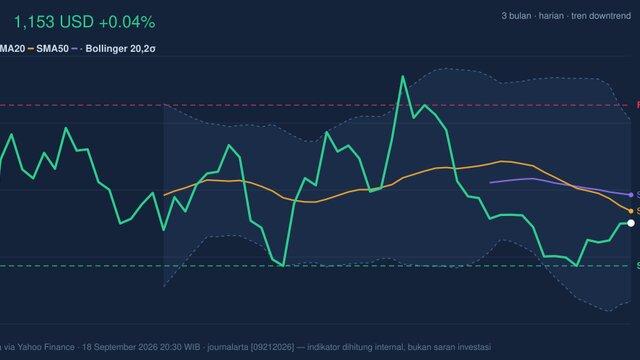
LLY Stock Analysis: Gains 0.04%, Momentum Weakens
On September 21, 2026: price 1,152.93 USD, trend downtrend, RSI 47.7, support 1,115.70, resistance 1,255.40. technical analysis of lly stock.
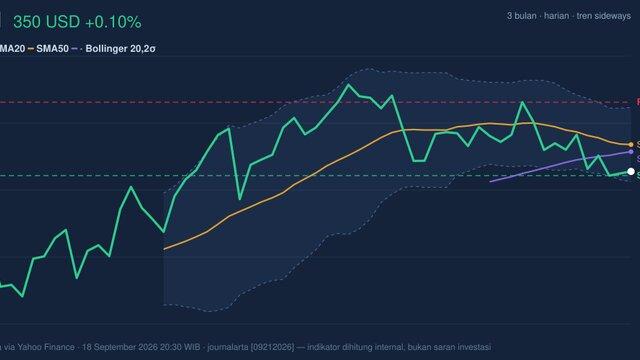
JPM Stock Analysis: Gains 0.10%, Testing Support Level
On September 21, 2026: price 349.67 USD, trend sideways, RSI 44.2, support 348.92, resistance 362.06. technical analysis of jpm stock.
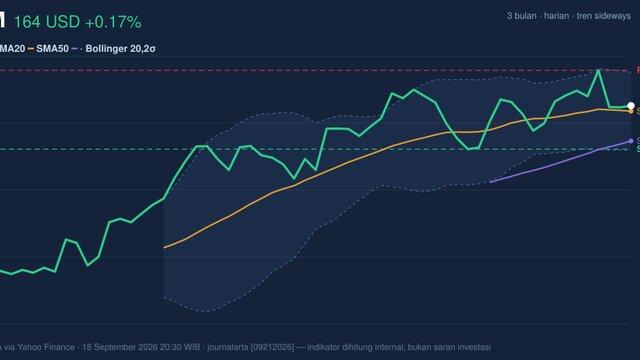
XOM Stock Analysis: Gains 0.17%, Momentum Weakens
On September 21, 2026: price 163.54 USD, trend sideways, RSI 53.8, support 156.44, resistance 169.32. technical analysis of xom stock.
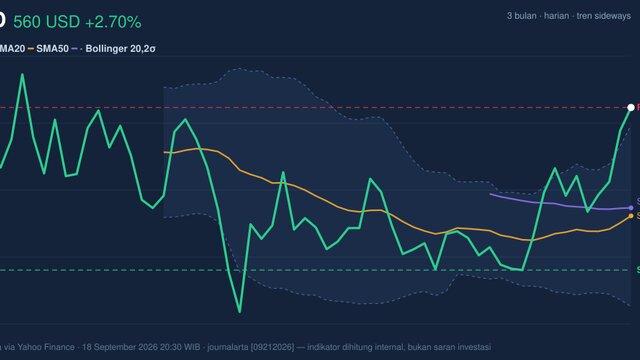
AMD Stock Gains 2.70%, Testing Key Resistance In Focus
On September 21, 2026: price 559.82 USD, trend sideways, RSI 65.1, support 456.16, resistance 559.82. technical analysis of amd stock.
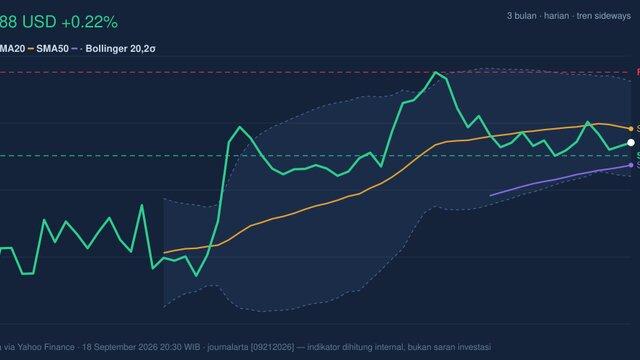
KO Stock Gains 0.22%, Testing Support Level In Focus
On September 21, 2026: price 88.25 USD, trend sideways, RSI 51.0, support 87.55, resistance 91.99. technical analysis of ko stock.
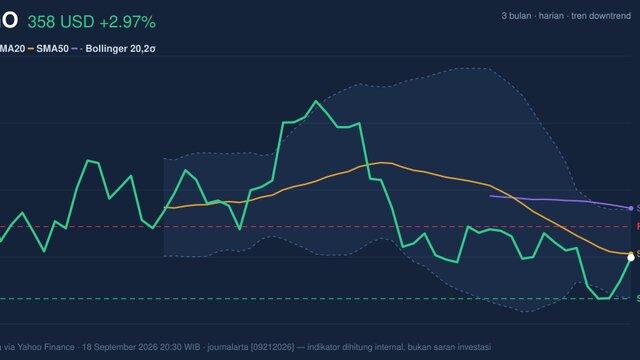
AVGO Stock Gains 2.97% Today, Momentum Weakens
On September 21, 2026: price 357.61 USD, trend downtrend, RSI 45.5, support 339.27, resistance 371.54. technical analysis of avgo stock.
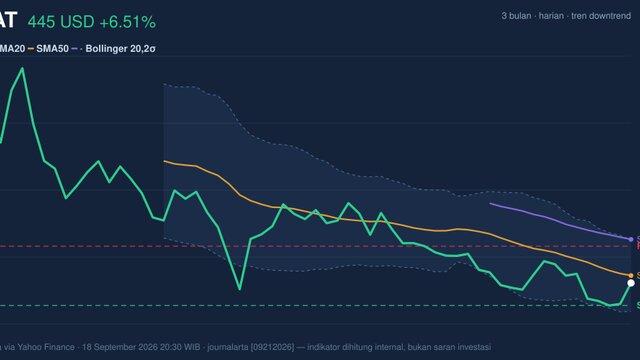
AMAT Stock Gains 6.51%, Momentum Gains In Focus
On September 21, 2026: price 444.57 USD, trend downtrend, RSI 43.4, support 415.38, resistance 492.32. technical analysis of amat stock.
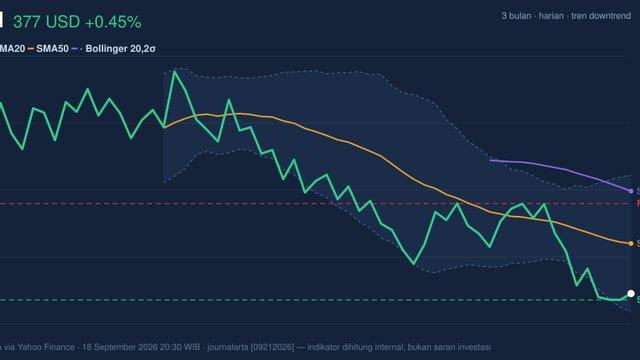
UNH Stock Technicals Today: Gains 0.45%, Testing Support Level
On September 21, 2026: price 376.90 USD, trend downtrend, RSI 37.0, support 375.21, resistance 401.01. technical analysis of unh stock.
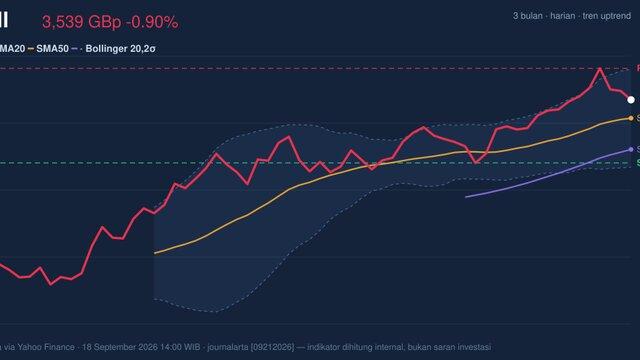
Shell Stock Analysis: Drops 0.90%, Momentum Gains
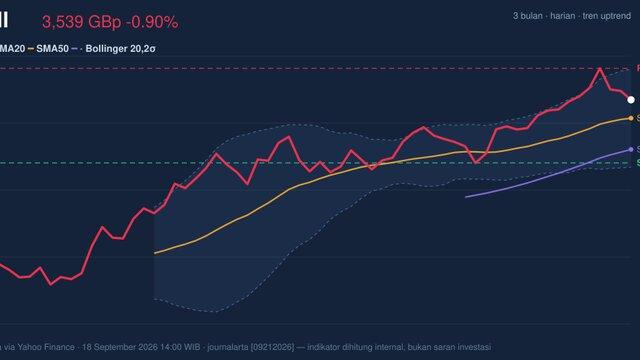
On September 21, 2026: price 3,539.00 GBp, trend uptrend, RSI 59.7, support 3,311.00, resistance 3,652.50. technical analysis of shell stock.
Shell Stock Analysis: Drops 0.90%, Momentum Gains
On September 21, 2026: price 3,539.00 GBp, trend uptrend, RSI 59.7, support 3,311.00, resistance 3,652.50. technical analysis of shell stock.
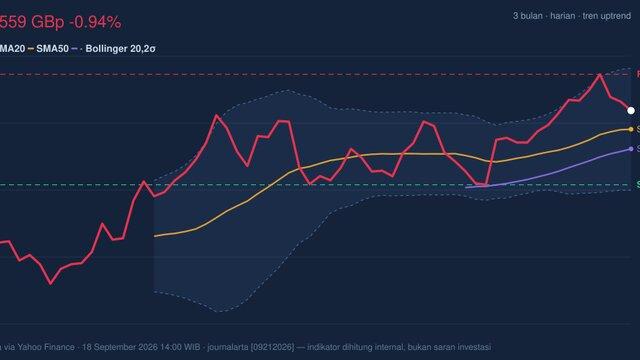
BP Stock Technicals Today: Drops 0.94%, Momentum Gains
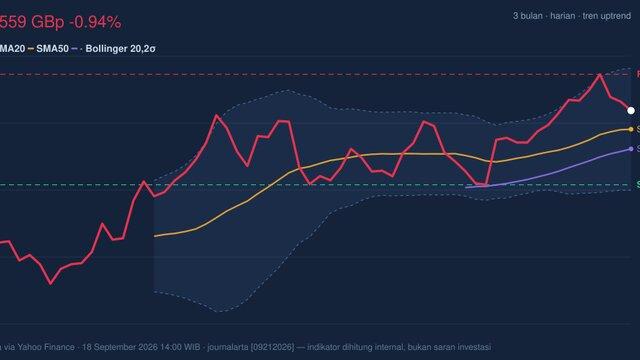
On September 21, 2026: price 558.70 GBp, trend uptrend, RSI 56.3, support 514.50, resistance 580.30. technical analysis of bp stock.
BP Stock Technicals Today: Drops 0.94%, Momentum Gains
On September 21, 2026: price 558.70 GBp, trend uptrend, RSI 56.3, support 514.50, resistance 580.30. technical analysis of bp stock.
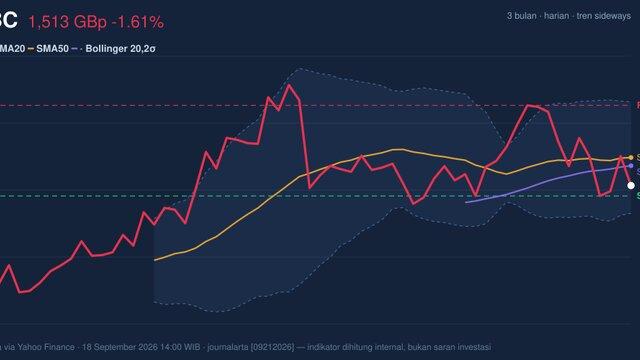
HSBC Testing Support Level: Stock Drops 1.61% (September 21, 2026)
On September 21, 2026: price 1,512.60 GBp, trend sideways, RSI 45.6, support 1,503.80, resistance 1,580.20. technical analysis of hsbc stock.
HSBC Testing Support Level: Stock Drops 1.61% (September 21, 2026)
On September 21, 2026: price 1,512.60 GBp, trend sideways, RSI 45.6, support 1,503.80, resistance 1,580.20. technical analysis of hsbc stock.
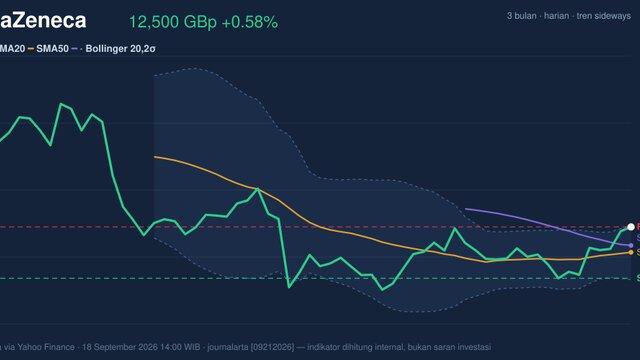
AstraZeneca Testing Key Resistance: Stock Gains 0.58% (September 21, 2026)
On September 21, 2026: price 12,500.00 GBp, trend sideways, RSI 59.6, support 11,650.00, resistance 12,500.00. technical analysis of astrazeneca stock.
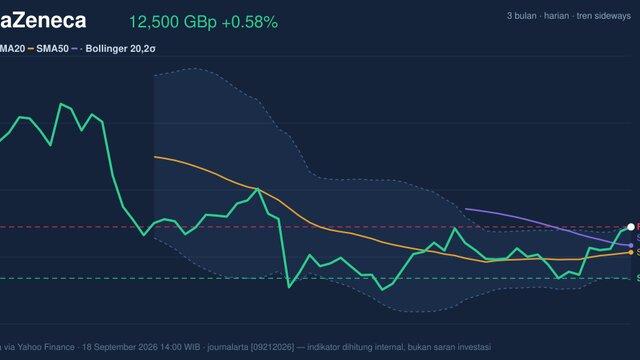
AstraZeneca Testing Key Resistance: Stock Gains 0.58% (September 21, 2026)
On September 21, 2026: price 12,500.00 GBp, trend sideways, RSI 59.6, support 11,650.00, resistance 12,500.00. technical analysis of astrazeneca stock.