Markets
The latest markets news and analysis from JournalArta Global.
Live prices & market news: Markets overview · Stocks · Crypto · Forex · Commodities
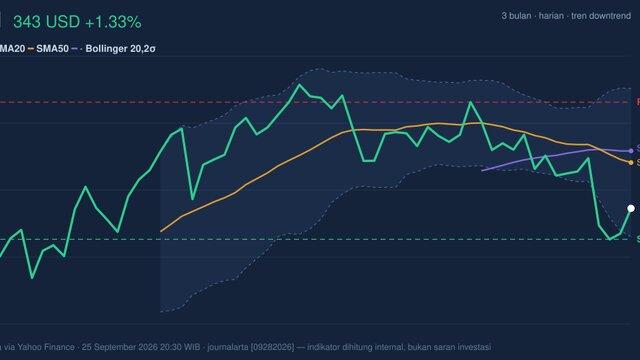
JPM Stock Gains 1.33%, Death Cross Pressure In Focus
On September 28, 2026: price 343.06 USD, trend downtrend, RSI 41.7, support 337.53, resistance 362.06. technical analysis of jpm stock.
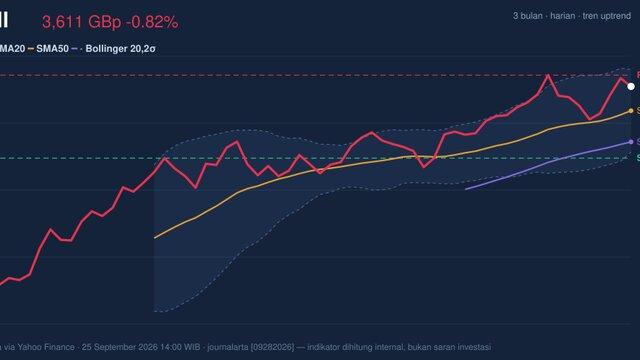
Shell Stock Drops 0.82%, Testing Key Resistance In Focus
On September 28, 2026: price 3,611.00 GBp, trend uptrend, RSI 62.5, support 3,344.50, resistance 3,652.50. technical analysis of shell stock.
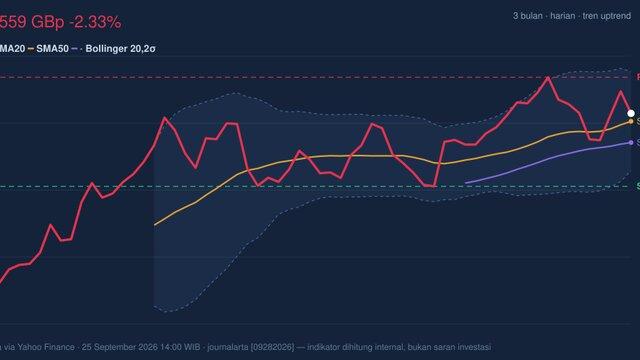
BP Stock Drops 2.33% Today, Momentum Weakens
On September 28, 2026: price 558.50 GBp, trend uptrend, RSI 54.0, support 514.50, resistance 580.30. technical analysis of bp stock.
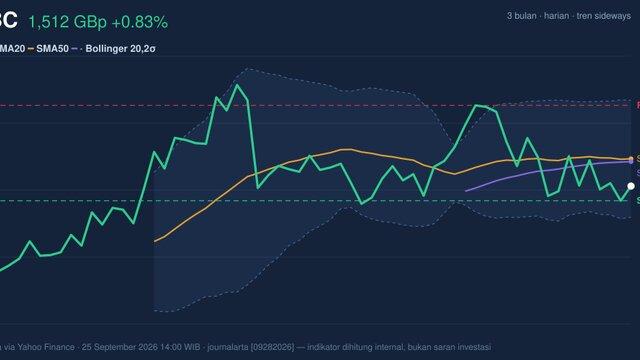
HSBC Stock Analysis: Gains 0.83%, Testing Support Level
On September 28, 2026: price 1,512.20 GBp, trend sideways, RSI 46.8, support 1,499.80, resistance 1,580.20. technical analysis of hsbc stock.
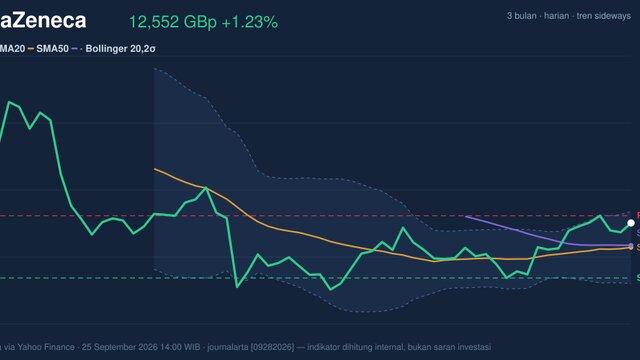
AstraZeneca Stock Analysis: Gains 1.23%, Testing Key Resistance
On September 28, 2026: price 12,552.00 GBp, trend sideways, RSI 57.7, support 11,650.00, resistance 12,672.00. technical analysis of astrazeneca stock.
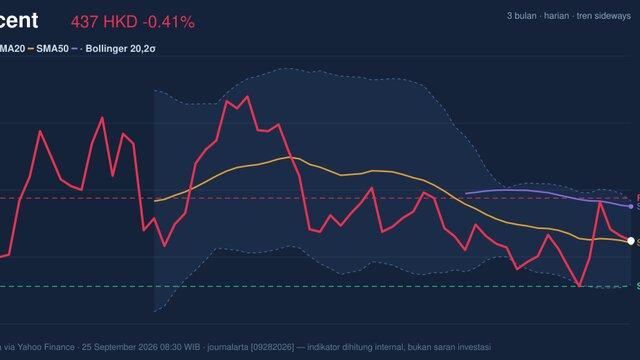
Tencent Stock Technicals Today: Drops 0.41%, Momentum Gains
On September 28, 2026: price 436.60 HKD, trend sideways, RSI 48.6, support 419.00, resistance 453.00. technical analysis of tencent stock.
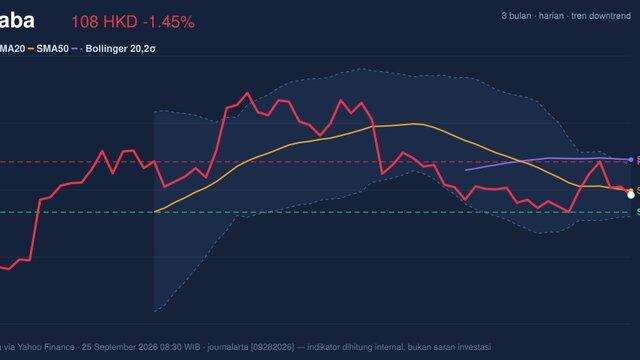
Alibaba Stock Drops 1.45% Today, Momentum Gains
On September 28, 2026: price 108.40 HKD, trend downtrend, RSI 45.2, support 105.10, resistance 114.80. technical analysis of alibaba stock.
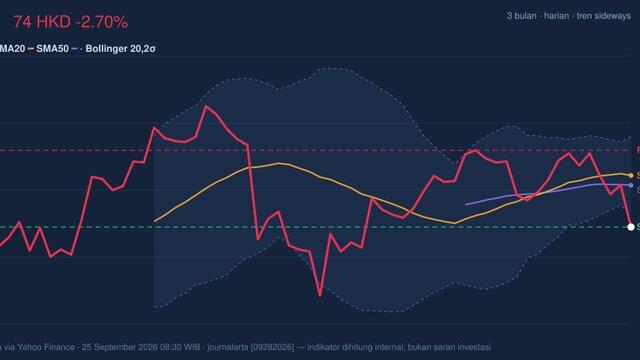
AIA Stock Drops 2.70%, Testing Support Level In Focus
On September 28, 2026: price 73.75 HKD, trend sideways, RSI 40.3, support 73.75, resistance 77.50. technical analysis of aia stock.
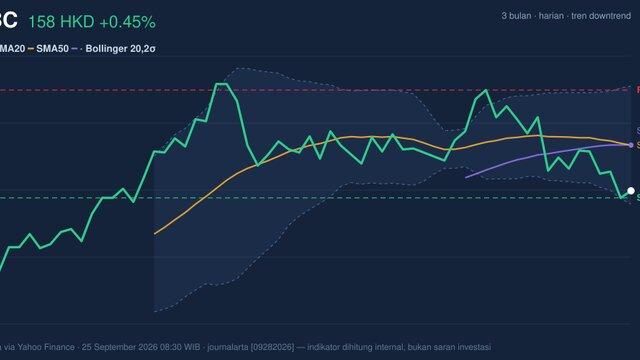
HSBC Stock Analysis: Gains 0.45%, Death Cross Pressure
On September 28, 2026: price 157.60 HKD, trend downtrend, RSI 40.9, support 156.90, resistance 167.60. technical analysis of hsbc stock.
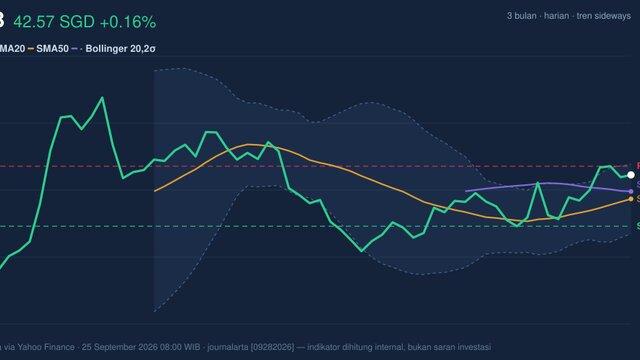
UOB Stock Technicals Today: Gains 0.16%, Testing Key Resistance
On September 28, 2026: price 42.57 SGD, trend sideways, RSI 57.7, support 40.99, resistance 42.84. technical analysis of uob stock.
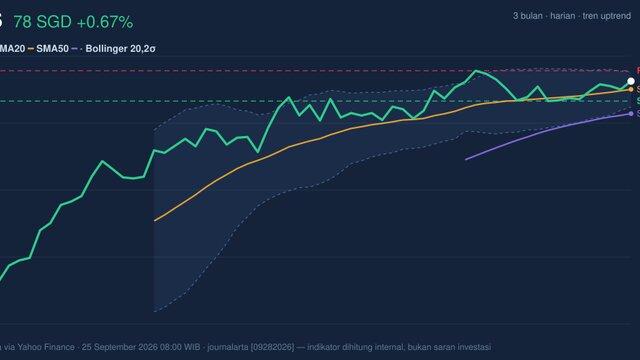
DBS Testing Key Resistance: Stock Gains 0.67% (September 28, 2026)
On September 28, 2026: price 78.00 SGD, trend uptrend, RSI 59.9, support 76.75, resistance 78.65. technical analysis of dbs stock.
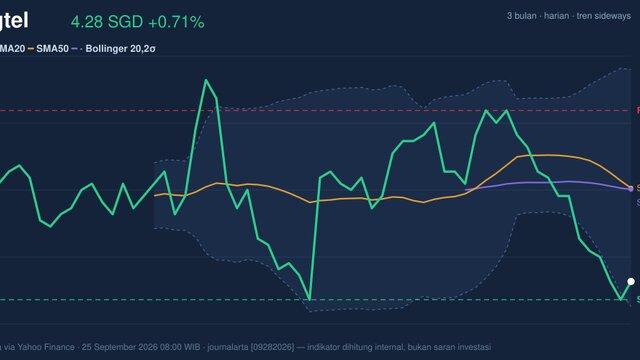
Singtel Stock Gains 0.71%, Testing Support Level In Focus
On September 28, 2026: price 4.28 SGD, trend sideways, RSI 34.6, support 4.25, resistance 4.56. technical analysis of singtel stock.
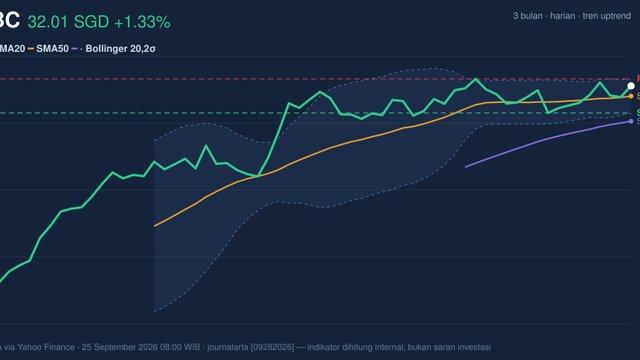
OCBC Testing Key Resistance: Stock Gains 1.33% (September 28, 2026)
On September 28, 2026: price 32.01 SGD, trend uptrend, RSI 59.3, support 31.00, resistance 32.27. technical analysis of ocbc stock.
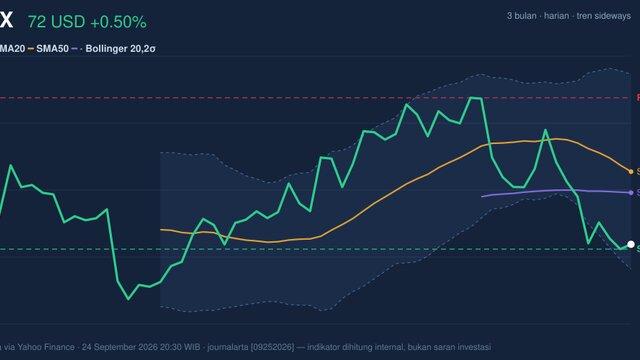
NFLX Stock Gains 0.50% Today, Testing Support Level
On September 25, 2026: price 71.72 USD, trend sideways, RSI 38.7, support 71.36, resistance 82.73. technical analysis of nflx stock.
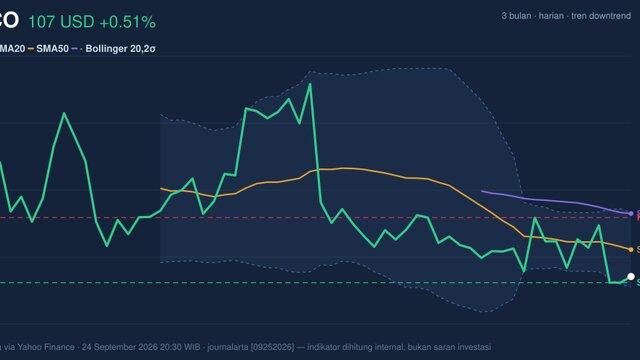
CSCO Stock Analysis: Gains 0.51%, Testing Support Level
On September 25, 2026: price 106.97 USD, trend downtrend, RSI 42.1, support 106.43, resistance 112.15. technical analysis of csco stock.
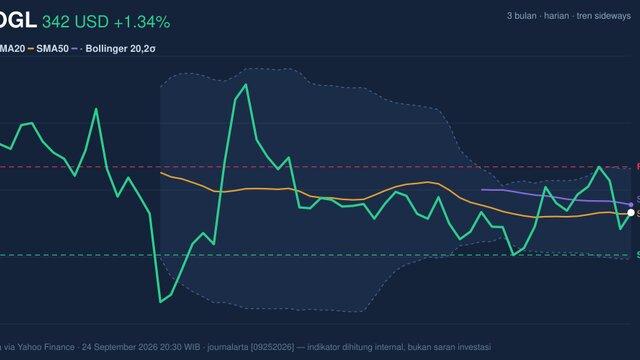
Momentum Gains, GOOGL Stock Gains 1.34% Today
On September 25, 2026: price 342.36 USD, trend sideways, RSI 48.9, support 330.65, resistance 354.97. technical analysis of googl stock.
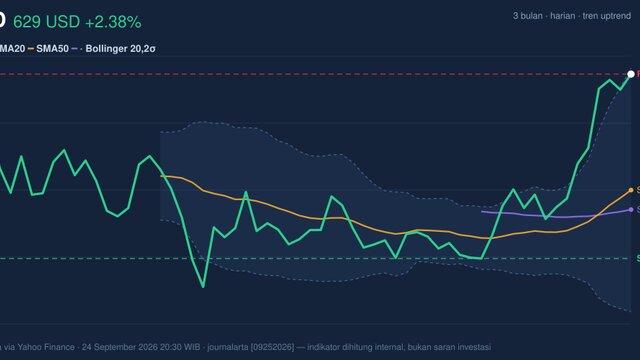
AMD RSI Overbought: Stock Gains 2.38% (September 25, 2026)
On September 25, 2026: price 629.26 USD, trend uptrend, RSI 72.7, support 456.16, resistance 629.26. technical analysis of amd stock.
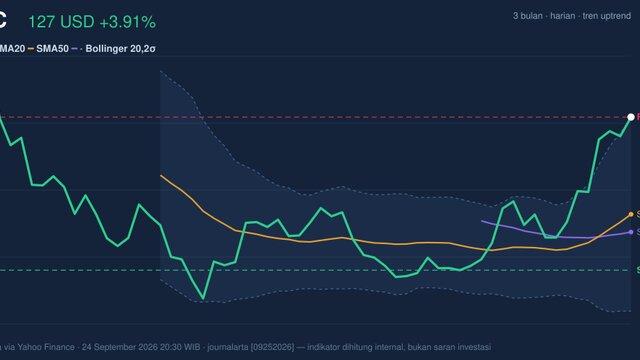
INTC Stock Analysis: Gains 3.91%, RSI Overbought
On September 25, 2026: price 127.39 USD, trend uptrend, RSI 72.6, support 88.97, resistance 127.39. technical analysis of intc stock.
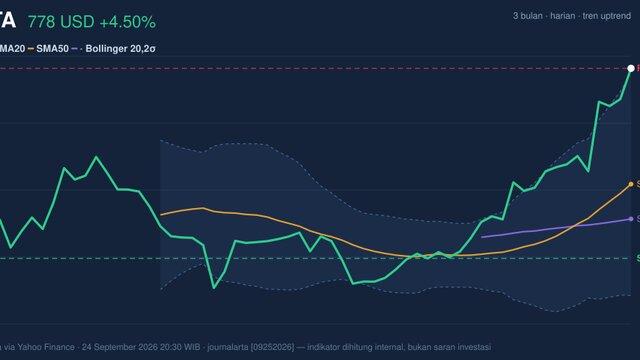
RSI Overbought, META Stock Gains 4.50% Today
On September 25, 2026: price 777.59 USD, trend uptrend, RSI 80.8, support 571.10, resistance 777.59. technical analysis of meta stock.
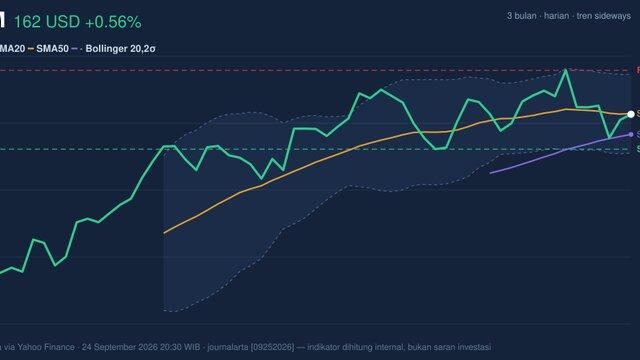
XOM Stock Gains 0.56% Today, Momentum Weakens
On September 25, 2026: price 162.14 USD, trend sideways, RSI 51.4, support 156.44, resistance 169.32. technical analysis of xom stock.
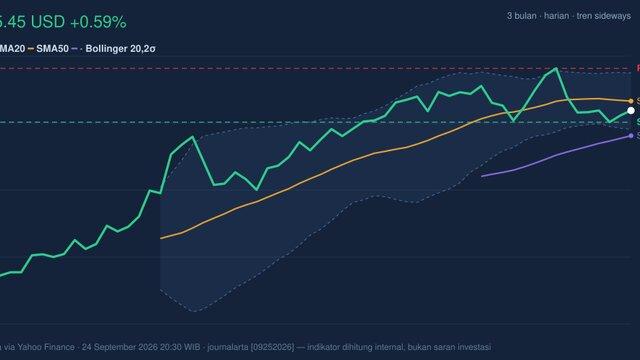
T Testing Support Level: Stock Gains 0.59% (September 25, 2026)
On September 25, 2026: price 25.45 USD, trend sideways, RSI 51.1, support 25.10, resistance 26.72. technical analysis of t stock.
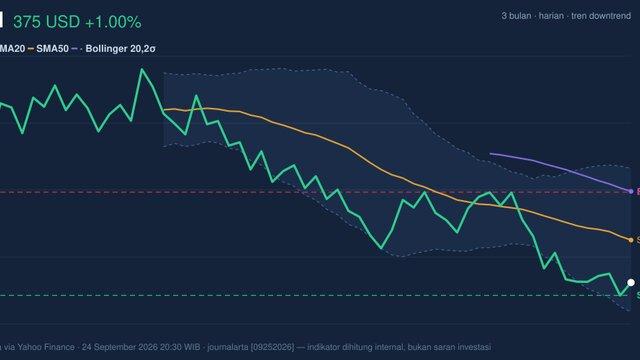
UNH Stock Gains 1.00%, Testing Support Level In Focus
On September 25, 2026: price 375.01 USD, trend downtrend, RSI 37.8, support 371.29, resistance 401.01. technical analysis of unh stock.
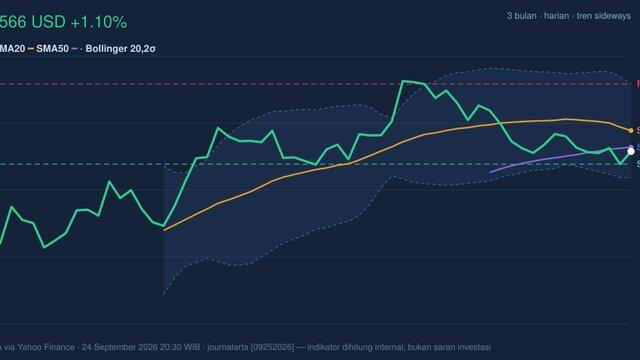
MA Stock Gains 1.10% Today, Testing Support Level
On September 25, 2026: price 566.08 USD, trend sideways, RSI 47.0, support 559.92, resistance 598.47. technical analysis of ma stock.
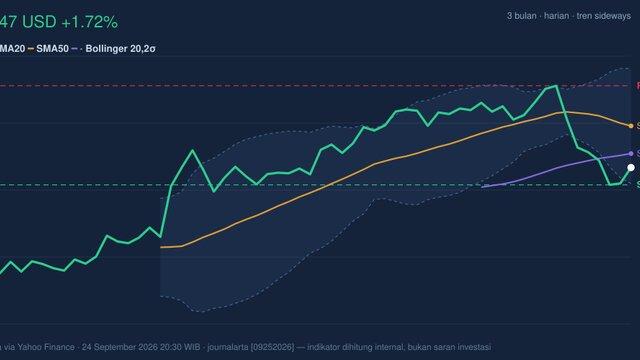
Momentum Weakens, VZ Stock Gains 1.72% Today
On September 25, 2026: price 47.32 USD, trend sideways, RSI 40.7, support 46.45, resistance 51.45. technical analysis of vz stock.