O’Reilly Automotive (ORLY) Stock Rises 0.55% on Monday, Up 3.2% in Five Sessions
Technical analysis of ORLY stock on November 16, 2026: price 92.70 USD, trend uptrend, RSI 61.1, support 88.07, resistance 92.70.

Trend & Price Action
The shares gained 3.24% over five sessions and 4.08% over one month. At $92.70, ORLY stood above its 20-day simple moving average (SMA) of $90.46 and its 50-day average of $87.71. The 20-day average rose 0.94% over five days, confirming that the shorter-term trend is advancing rather than merely reflecting a one-session bounce. There was no new moving-average crossover, so the signal comes from the averages’ current position and direction, not a fresh cross. The price was at the top of its 20-session range, with resistance at $92.70, and below its three-month high of $93.75. That leaves limited room before a nearby reference point, even as the rising averages provide a lower support structure. The trend is rising, but the stock is pressing against resistance.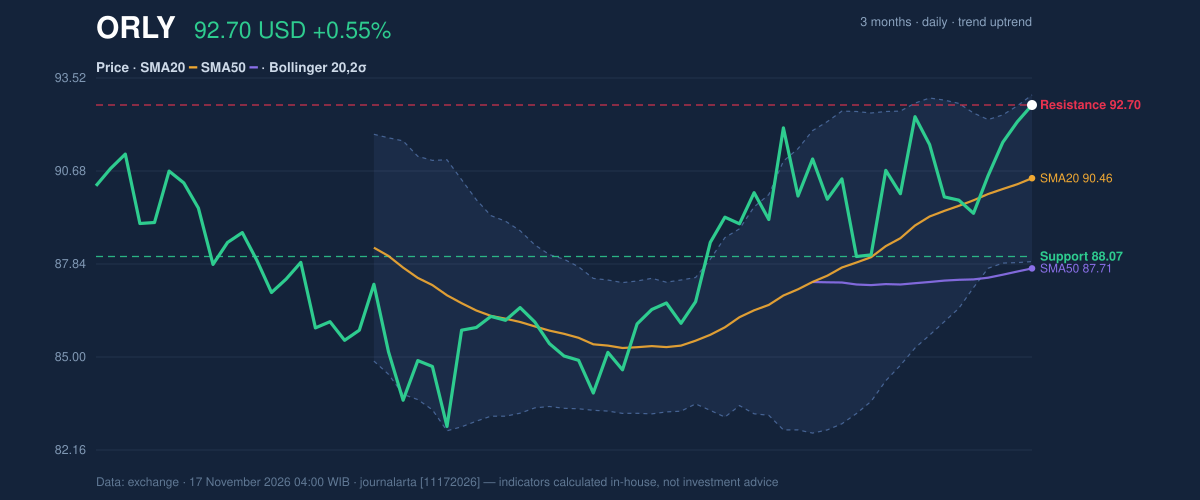
Oscillators & Momentum
The MACD, a measure comparing shorter- and longer-term price momentum, was positive at 1.039 against a signal line of 0.914; its histogram was 0.124. The positive histogram supports the direction of the trend. The RSI was 61.1, in neutral territory, indicating upward momentum without an extreme reading by that measure. The Stochastic reading tells a more stretched story: %K was 85.1 and %D was 77.3, a signal classified as overbought. That does not by itself establish a reversal, but it does raise the chance that near-term gains could pause. The indicators are therefore not fully aligned: MACD confirms positive momentum, while Stochastic cautions that the advance may be extended.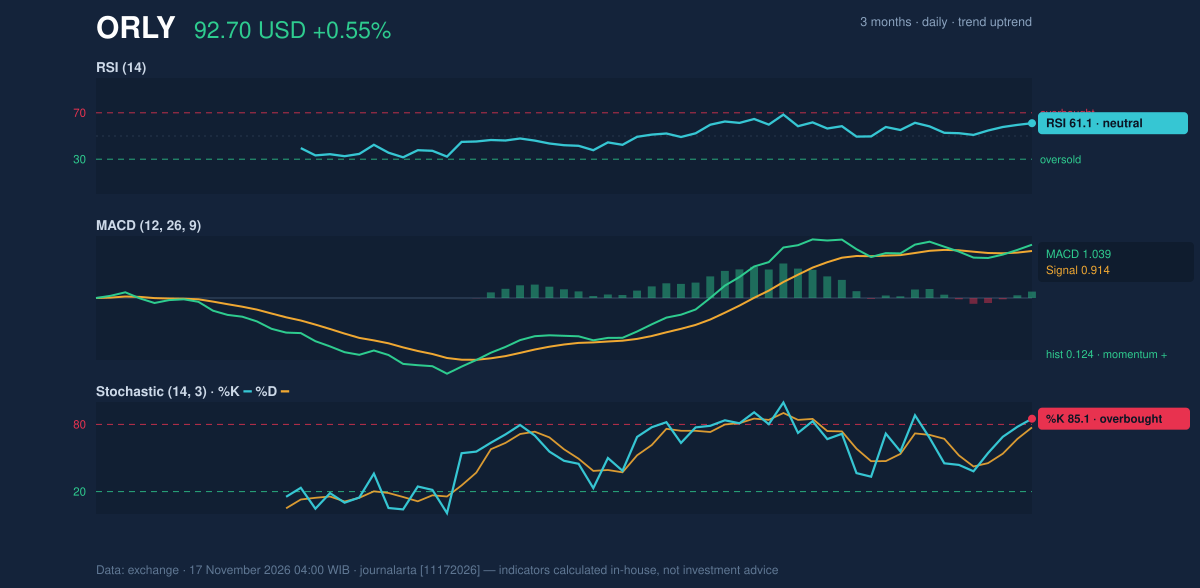
Volatility, Volume & Key Levels
ORLY’s Bollinger Bands were narrowing, with a width of 5.6%, a configuration often called a squeeze. A squeeze signals that recent price swings have contracted; it can precede a larger move, but does not indicate its direction. The %B reading of 94% placed the price close to the upper band at $93.01, leaving little distance between the close and that boundary. The lower band was $87.92, while the band midpoint was $90.46. Average true range (ATR), a measure of typical daily movement, was $2.36, or 2.5% of the share price—moderate volatility. Volume was 5,823,500 shares, below the 20-session average of 6,755,740, at 0.9 times normal. That lighter participation makes the session’s advance less forcefully confirmed by trading activity, although rising on-balance volume (OBV), which tracks the relationship between price and volume, points to accumulation over the broader period. The immediate level to watch is $92.70 resistance; the three-month high is $93.75. A sustained move above those levels would mark a test of the recent range ceiling. On the downside, $90.46, the 20-day average, and $88.07 support are reference points if momentum fades. The three-month low is $82.83.Fundamental Context
According to its SEC filing, O’Reilly reported quarterly revenue of $5.12 billion for the quarter ended September 30, 2026, up 8.8% from $4.71 billion a year earlier. Net income was $785.6 million, compared with $725.9 million, and diluted earnings per share were $0.97. The filing shows growth in both revenue and net income; the technical verdict below, however, is based on the chart signals and levels.Technical Verdict: BUY
JournalArta's research board scores ORLY at +92 on a −100 to +100 scale, past the +60 Buy threshold, driven by 3 bullish vs 0 bearish technical signals, price above its 50-day average, the 20-day average above the 50-day, an uptrend.
Why ORLY is in focus today
Selected automatically from 8 NASDAQ (US) stocks by a technical-signal score with daily weighted randomisation — not a recommendation.
- Entry zone: 90.94 – 92.70
- Target 1 / 2: 100.36 / 108.03
- Stop loss: 87.59
- Reward/risk: 1.5 / 3.0
- Valid until: 15 Dec 2026
The call is void if price falls to 87.59 or fails to revisit the entry zone within five sessions.
In plain terms: the technical picture for ORLY points up, with a clear exit if it fails at 87.59.
Summary Data ORLY
| Last price | 92.70 USD |
| Change 1 day / 5 days / 1 month | 0.55% / 3.24% / 4.08% |
| Trend / MA-cross | uptrend / none |
| SMA20 / SMA50 | 90.46 / 87.71 |
| RSI (14) / Stochastic %K | 61.1 / 85.1 |
| Bollinger %B / ATR | 94% / 2.36 |
| Support / Resistance 20 days | 88.07 / 92.70 |
| Data as of | 17 November 2026 04:00 WIB |
| JournalArta research verdict (score) | Buy (+92) |
| Entry zone | 90.94 – 92.70 |
| Target 1 / 2 | 100.36 / 108.03 |
| Stop loss | 87.59 |
| Reward/risk | 1.5 / 3.0 |
Today's full Buy and Sell list for US stocks →
Disclaimer: This technical analysis is generated automatically from exchange data and indicators calculated by JournalArta, for information and education only. The verdict and the entry, target and stop-loss levels are not investment advice or a solicitation to buy or sell any security. Investment decisions and their risks rest solely with the reader.
Track ORLY stock price daily: live levels, support/resistance and our full ORLY analysis history.
 Take the quizWhat Kind of Holiday Spender Are You? Take the Black Friday QuizStart →
- 1U.S. Emergency Alert Test Nov. 17 Is Not a Power Outage

- 2Women With Autoimmune Diseases Wait About 4 Years for Diagnosis, Study Finds

- 3DUP Chairman Lord Morrow Loses Wife and Daughter Within Hours in NI

- 4Micron Stock Falls 28% as $35.16 Billion Buyback Nears

- 5I’m A Celebrity 2026 Line-Up: Rooney Leads 11 Stars Into Jungle

 Lifestyle7 Signs Your Social Battery Is Running Low (and Why You Keep Cancelling Plans)
 Lifestyle · Food & HealthThanksgiving Food Safety: How Long Leftovers Last and the Safe Turkey Temperature
 Lifestyle7 Quiet Habits of Emotionally Intelligent People, According to Psychologists
 LifestylePeople Who Don’t Like Celebrating Their Birthday Often Share These 7 Traits