Taiwan Semiconductor (TSM) Stock on Monday: Tumbles 6.34%, Down 11.1% in a Month
Technical analysis of TSM stock on November 16, 2026: price 373.45 USD, trend downtrend, RSI 38.6, support 353.10, resistance 439.51.
Why TSM is in focus today
- One-day move of 0.00%, about 0.0× its average daily range (ATR)
Selected automatically from 8 NYSE (US) stocks by a technical-signal score with daily weighted randomisation — not a recommendation.
Trend & Price Action
At $373.45, TSMC is well below its 20-day average of $406.52 and its 50-day average of $429.00. The shorter average is also below the longer one, a configuration consistent with a weakening trend, although no new moving-average cross formed in the latest session. The 20-day average fell 1.72% over five days, confirming that the deterioration is not limited to a single sharp session. The shares sit 24% of the way through their 20-session range, between support at $353.10 and resistance at $439.51. They are also near the three-month low of $351.19, while the three-month high stands at $487.47. This positioning leaves limited room before the recent support area is tested, but does not by itself confirm that support will fail. As shown in the chart, price is below both moving averages and near the lower Bollinger Band; the band’s widening signals elevated volatility rather than a settled base.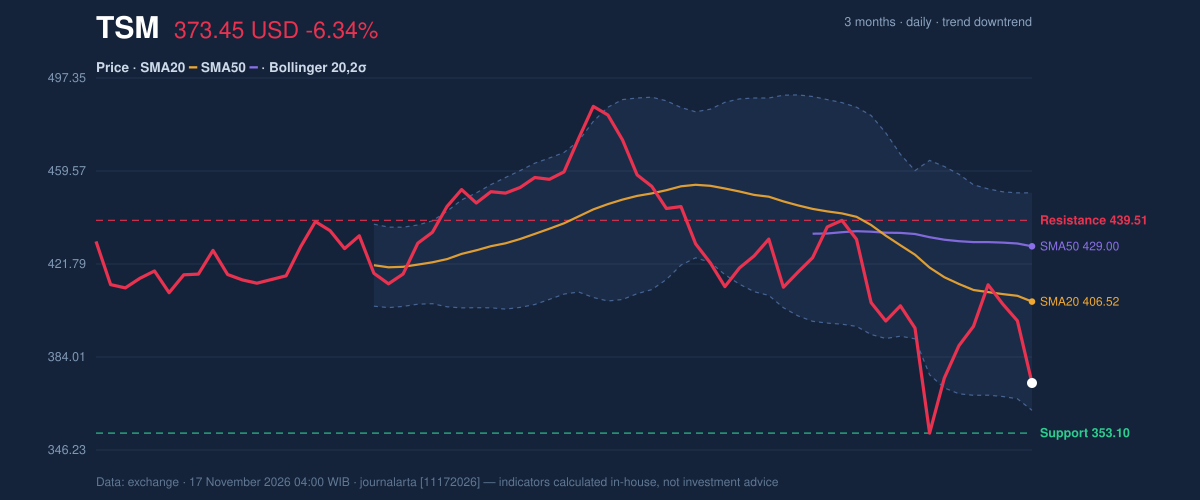
Oscillators & Momentum
The RSI is 38.6, a neutral reading, not yet an oversold signal. The Stochastic readings are also classified as neutral, with %K at 24.8 and %D at 46.1. The gap between the two shows weaker short-term momentum, but these readings do not establish that a reversal has begun. The MACD is more clearly bearish: its histogram is negative at -0.605, with the MACD at -12.139 below its signal line at -11.534. The reported technical signals show no bullish signals against two bearish ones. In practical terms, momentum measures are not giving a strong rebound confirmation, even as the RSI and Stochastic stop short of extreme readings.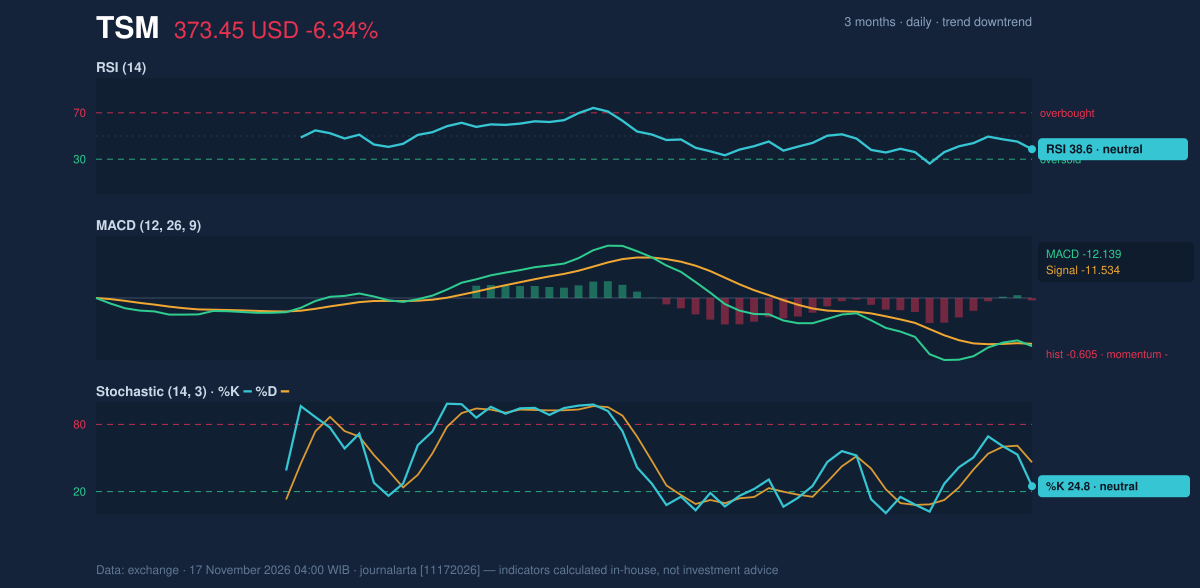
Volatility & Volume
The Bollinger Bands are wide, with a 21.7% band width, and the share price is at just 13% of the distance from the lower to the upper band. The lower band is $362.34 and the upper band is $450.69. A low position within widening bands indicates that selling pressure has pushed price toward the lower boundary while daily swings remain large; it is not, on its own, proof that the stock must rebound. The ATR is $19.91, or 5.3% of the share price, which the data classifies as high volatility. Volume reached 19,483,600 shares against a 20-session average of 14,828,240, while OBV fell. OBV, or on-balance volume, tracks whether trading volume generally accompanies rising or falling prices. Its decline alongside heavier turnover adds evidence that participation has been tilted toward selling.Technical Verdict: SELL
The JournalArta Research verdict is SELL, with a score of -76 on a scale from -100 to +100. The call reflects the downtrend, price below its 50-day average and a 20-day average below the 50-day, alongside zero bullish and two bearish technical signals. The negative MACD histogram and falling OBV reinforce that reading. The main near-term risk to the bearish setup is a recovery toward the moving averages; high volatility also means support could hold and prompt a sharp bounce. The verdict is invalidated if price rises above the $407.29 stop-loss level. - Entry range: $373.45–$388.37 - Exit targets: Target 1 at $322.69; Target 2 at $271.93 - Stop-loss protection: $407.29 For non-traders, the verdict means the indicators currently favor continued weakness, but a move above the stated stop level would invalidate that assessment.| Data | Reading |
|---|---|
| Last price | $373.45 |
| Change | 1 day -6.34% | 5 days -3.90% | 1 month -11.13% |
| 20-day / 50-day average | $406.52 / $429.00 |
| Support / resistance | $353.10 / $439.51 |
| Verdict levels | Entry $373.45–$388.37 | Targets $322.69 / $271.93 | Stop $407.29 |
| Verdict validity | Through December 15, 2026 |
Summary Data TSM
| Last price | 373.45 USD |
| Change 1 day / 5 days / 1 month | -6.34% / -3.90% / -11.13% |
| Trend / MA-cross | downtrend / none |
| SMA20 / SMA50 | 406.52 / 429.00 |
| RSI (14) / Stochastic %K | 38.6 / 24.8 |
| Bollinger %B / ATR | 13% / 19.91 |
| Support / Resistance 20 days | 353.10 / 439.51 |
| Data as of | 17 November 2026 04:00 WIB |
| JournalArta research verdict (score) | Sell (-76) |
| Sell zone | 373.45 – 388.37 |
| Target 1 / 2 | 322.69 / 271.93 |
| Stop loss | 407.29 |
| Reward/risk | 1.5 / 3.0 |
Disclaimer: This technical analysis is generated automatically from exchange data and indicators calculated by JournalArta, for information and education only. The verdict and the entry, target and stop-loss levels are not investment advice or a solicitation to buy or sell any security. Investment decisions and their risks rest solely with the reader.
Track TSM stock price daily: live levels, support/resistance and our full TSM analysis history.
 Take the quizWhat Kind of Holiday Spender Are You? Take the Black Friday QuizStart →
Most Read
- 1U.S. Emergency Alert Test Nov. 17 Is Not a Power Outage

- 2Women With Autoimmune Diseases Wait About 4 Years for Diagnosis, Study Finds

- 3DUP Chairman Lord Morrow Loses Wife and Daughter Within Hours in NI

- 4Micron Stock Falls 28% as $35.16 Billion Buyback Nears

- 5I’m A Celebrity 2026 Line-Up: Rooney Leads 11 Stars Into Jungle

Don't Miss
 Lifestyle7 Signs Your Social Battery Is Running Low (and Why You Keep Cancelling Plans)
 Lifestyle · Food & HealthThanksgiving Food Safety: How Long Leftovers Last and the Safe Turkey Temperature
 Lifestyle7 Quiet Habits of Emotionally Intelligent People, According to Psychologists
 LifestylePeople Who Don’t Like Celebrating Their Birthday Often Share These 7 Traits