Rolls-Royce Share Price Today (LSE: RR)
Rolls-Royce Holdings · London Stock Exchange · Data as of 7 November 2026 00:15 WIB
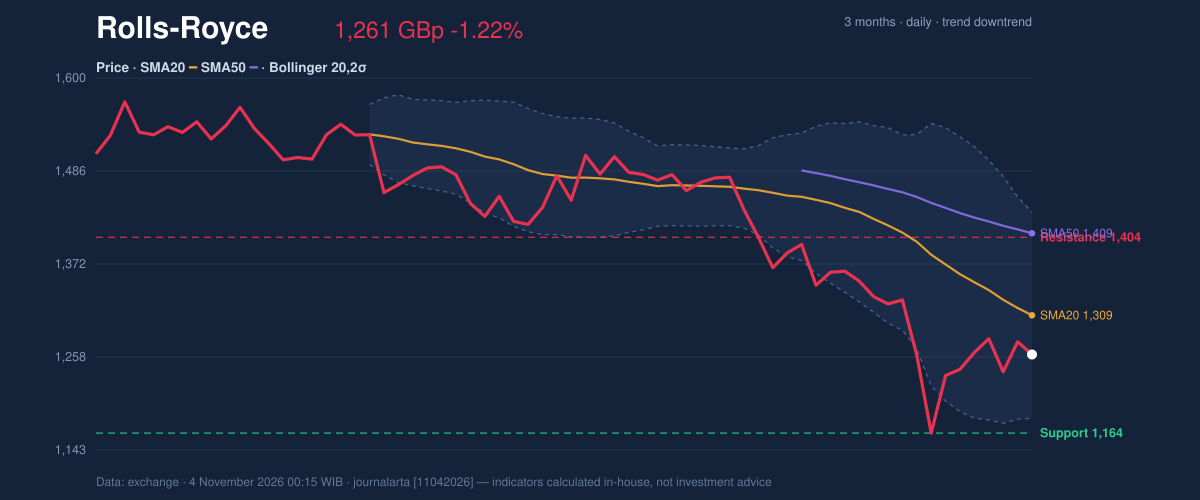
Latest analysis: Rolls-Royce Stock Technicals: Drops 1.22% on Tuesday, Momentum Gains (2026-11-04)
Quick answers
What is the Rolls-Royce share price today?
Rolls-Royce Holdings (LSE: RR) last traded at 1,261 GBp, a change of 1.74% from the previous close. Data as of 7 November 2026 00:15 WIB.
Is Rolls-Royce stock in an uptrend or downtrend?
Based on the 20- and 50-day moving averages, Rolls-Royce is currently in a downtrend (price below SMA20 and SMA50). The 14-day RSI is 41.6 (neutral range).
What are the key support and resistance levels for Rolls-Royce?
Over the last 20 trading days the support level is around 1,164 GBp and resistance is around 1,396 GBp. The 3-month range is 1,159 to 1,586 GBp.
How often is this Rolls-Royce page updated?
Prices and indicators refresh throughout trading days from exchange data, and a new technical analysis article is published on most trading days. This page is information, not investment advice.
Rolls-Royce analysis history
- Rolls-Royce Stock Technicals: Drops 1.22% on Tuesday, Momentum Gains 2026-11-04 · EN
- Rolls-Royce Stock Analysis: Drops 7.57%, RSI Oversold 2026-10-26 · EN
- Rolls-Royce Stock Drops 0.68%, Testing Support Level In Focus 2026-10-21 · EN
- Rolls-Royce Stock Analysis: Drops 1.41%, Testing Support Level 2026-10-20 · EN
- Rolls-Royce Stock Analysis: Drops 2.35%, Testing Support Level 2026-10-08 · EN
Prices and indicators are derived from exchange data via Yahoo Finance and may be delayed. This page is technical information, not investment advice. · Versi Bahasa Indonesia