JournalArta
Sunday, November 8, 2026 · JakartaS&P 7,376.86 ▲0.32%USD/IDR 18,004 ▼0.25%Subscribe
JournalArta
Global Edition
beyond headlines
S&P 5007,376.86▲0.32%
Nasdaq24,579.42▲1.09%
Dow Jones51,285.73▼0.46%
FTSE 10010,673.94▼1.01%
DAX25,820.36▼1.92%
Euro STOXX 506,170.49▼0.98%
Nikkei 22557,435▼5.97%
Hang Seng24,482▼1.27%
IHSG5,050.43▲0.40%
USD/IDR18,004▼0.25%
EUR/USD1.1143▼0.67%
USD/JPY158.43▲0.49%
GBP/USD1.3356▼0.71%
USD/CNY6.6648▲0.10%
AUD/USD0.6868▼0.92%
USD/SGD1.2825▲0.34%
Brent$98.32▲0.03%
WTI$90.83▲0.34%
Gold$4,074.90▼0.94%
Silver$51.94▼0.83%
BTC$75,761▲0.01%
ETH$2,232▼0.24%
NVDA$186.64▲2.78%
S&P 5007,376.86▲0.32%
Nasdaq24,579.42▲1.09%
Dow Jones51,285.73▼0.46%
FTSE 10010,673.94▼1.01%
DAX25,820.36▼1.92%
Euro STOXX 506,170.49▼0.98%
Nikkei 22557,435▼5.97%
Hang Seng24,482▼1.27%
IHSG5,050.43▲0.40%
USD/IDR18,004▼0.25%
EUR/USD1.1143▼0.67%
USD/JPY158.43▲0.49%
GBP/USD1.3356▼0.71%
USD/CNY6.6648▲0.10%
AUD/USD0.6868▼0.92%
USD/SGD1.2825▲0.34%
Brent$98.32▲0.03%
WTI$90.83▲0.34%
Gold$4,074.90▼0.94%
Silver$51.94▼0.83%
BTC$75,761▲0.01%
ETH$2,232▼0.24%
NVDA$186.64▲2.78%
Advertisement
Markets › Stocks › LSE

Coca-Cola HBC Share Price Today (LSE: CCH)

Coca-Cola HBC · London Stock Exchange · Data as of 7 November 2026 00:06 WIB
4,188 GBp
▲ +3.36%
5d -10.97% · 1mo -2.20%
Trend / MA-crosssideways / golden
SMA20 / SMA504,530 / 4,463
RSI (14) / Stoch %K39.4 / 18
Bollinger %B / ATR(14)9% / 180.97
Support / Resistance (20d)4,052 / 4,934
3-month low / high3,998 / 5,060
Advertisement
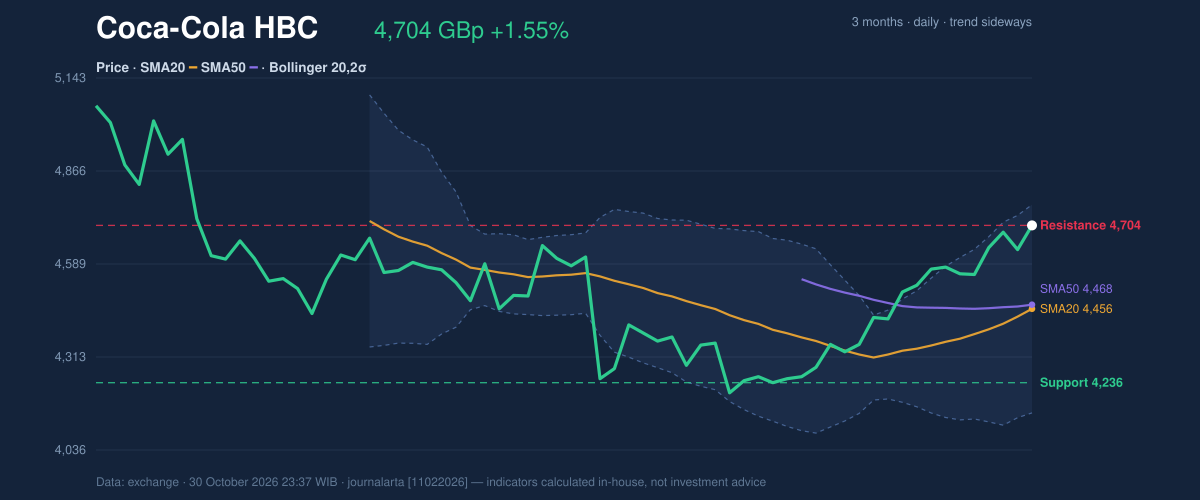
Coca-Cola HBC price action chart
Coca-Cola HBC 3-month price action from our latest analysis: price, SMA20/50, Bollinger bands, support and resistance.

Latest analysis: Coca-Cola HBC Testing Key Resistance: Stock Gains 1.55% (October 30, 2026) (2026-11-02)

Quick answers

What is the Coca-Cola HBC share price today?

Coca-Cola HBC (LSE: CCH) last traded at 4,188 GBp, a change of 3.36% from the previous close. Data as of 7 November 2026 00:06 WIB.

Is Coca-Cola HBC stock in an uptrend or downtrend?

Based on the 20- and 50-day moving averages, Coca-Cola HBC is currently in moving sideways. The 14-day RSI is 39.4 (neutral range).

What are the key support and resistance levels for Coca-Cola HBC?

Over the last 20 trading days the support level is around 4,052 GBp and resistance is around 4,934 GBp. The 3-month range is 3,998 to 5,060 GBp.

How often is this Coca-Cola HBC page updated?

Prices and indicators refresh throughout trading days from exchange data, and a new technical analysis article is published on most trading days. This page is information, not investment advice.

Advertisement

Coca-Cola HBC analysis history

Prices and indicators are derived from exchange data via Yahoo Finance and may be delayed. This page is technical information, not investment advice. · Versi Bahasa Indonesia