On October 30, 2026: price 75.40 HKD, trend sideways, RSI 60.0, support 68.80, resistance 75.40. technical analysis of aia stock.
By matthew jonathan
November 1, 20264 min read
Advertisement
AIA Stock Analysis
Why AIA is in focus today
One-day move of 5.23%, about 2.2× its average daily range (ATR)
Not covered by JournalArta in the last 14 days
Selected automatically from 16 HKEX (Hong Kong) stocks by a technical-signal score with daily weighted randomisation — not a recommendation.
AIA Group rose 5.23% to HK$75.40 on Friday, October 30, 2026, a one-day move about 2.2 times its average daily range, according to the supplied market data. The jump put the shares at the top of their 20-session trading range and above the upper Bollinger band, while the 20-day average is still sloping down. That mix points to forceful short-term buying against a broader sideways structure, rather than a confirmed change in trend.
Advertisement
Trend & Price Action
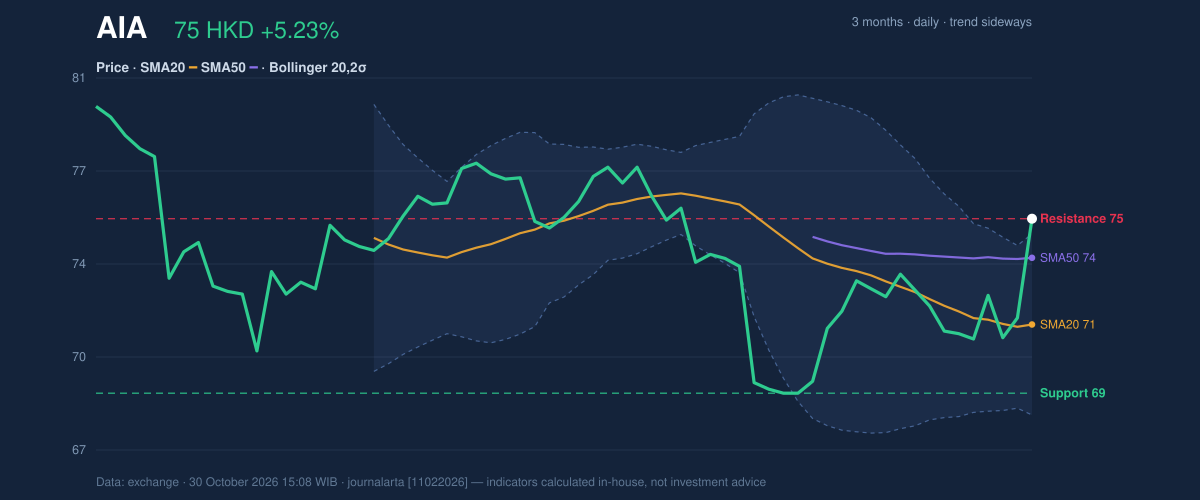
The stock gained 6.12% over five sessions and 2.45% over one month. At HK$75.40, it stood above both the 20-day simple moving average at HK$71.40 and the 50-day average at HK$73.92, but the 20-day average itself fell 0.68% over five days. In other words, price has recovered faster than its short-term trend measure; that can signal improving demand, but the declining average cautions against treating the move as a settled uptrend.
No new moving-average crossover was recorded. A crossover occurs when a shorter-term average moves through a longer-term one and is often used to gauge a trend shift; its absence means the latest rally has not yet produced that confirmation. The shares are also at the 100% position of the 20-session range, with HK$75.40 as resistance. The three-month high is HK$80.15, while the three-month low is HK$68.00.
As shown in the chart, price has pushed beyond the upper band even as the averages tell a more measured story.
3-month price action chart of AIA: price, SMA20/50, Bollinger, support & resistance.
Advertisement
Oscillators & Momentum
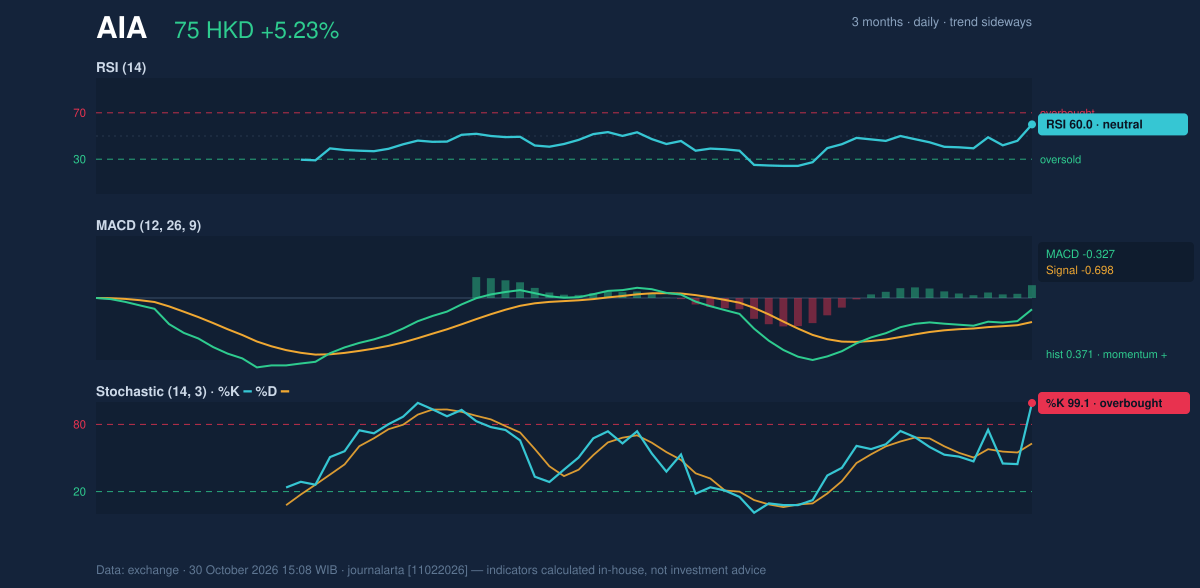
Momentum indicators are positive, but they are not uniformly comfortable. The RSI is 60.0, a neutral reading; it shows firmer momentum without, by itself, indicating an extreme. The Stochastic %K at 99.1, above %D at 62.9, is overbought, suggesting the latest advance may have run ahead of its recent trading pattern. “Overbought” does not guarantee an immediate fall, but it raises the risk that the move pauses or pulls back.
The MACD remains negative at -0.327, but its histogram is positive at 0.371, with the MACD above its signal line at -0.698. That combination indicates improving momentum while the MACD level remains below zero: selling pressure may be easing, though the indicator has not crossed into positive territory. The chart puts that contrast between a strong short-term push and incomplete trend confirmation in context.
Momentum chart of AIA: RSI(14), MACD, Stochastic.
Volatility & Volume
The share price is above the Bollinger upper band of HK$74.83, with %B at 108%. A %B reading above 100% means the price has moved outside the band, which can occur during a sharp advance but also signals that the move is stretched relative to recent volatility. The band width of 9.6% is described as normal, not unusually compressed; the breakout therefore comes without a preceding volatility squeeze in the supplied data.
Average true range, a measure of typical price movement, is HK$1.83, or 2.4% of the share price, indicating moderate volatility. Volume was 37,987,631 shares, about 1.2 times its 20-session average of 31,665,962, so the rise had above-normal participation. However, OBV—the cumulative measure of whether volume is flowing more on up or down sessions—was falling. That divergence makes the volume evidence less decisive: turnover was elevated, but the OBV direction does not confirm sustained accumulation.
Advertisement
Key Levels & Scenarios
The immediate reference is HK$75.40 resistance, which is also the latest price and the top of the 20-session range. A sustained move above it would bring the three-month high of HK$80.15 into view as the next chart reference, though the supplied data does not establish that level as a forecast. If the price fails to hold above the upper Bollinger band, the 50-day average at HK$73.92 is an intermediate reference; the 20-day average at HK$71.40 is a deeper trend marker.
The more substantial stated support is HK$68.80, with the three-month low at HK$68.00. A retreat toward support would test whether the rally has built a durable base. A break below HK$68.80 would weaken the short-term structure, particularly if the declining 20-day average and falling OBV persist.
Technical Verdict: HOLD
The technical reading is HOLD (wait & see), reflecting conflicting signals rather than a clear directional setup. Price is above both moving averages and MACD momentum is improving, but the declining 20-day average, overbought Stochastic and falling OBV leave the rally without broad confirmation.
Ideal entry range: HK$71.40–HK$73.92, the area between the 20-day and 50-day averages.
Exit target: HK$80.15, the three-month high.
Stop-loss protection: HK$68.80, the 20-session support; the verdict is invalidated if price falls below this level.
Advertisement
For non-traders, the shares have rallied sharply, but the indicators do not yet agree that the move is durable.
The supplied session data records AIA’s latest price at HK$75.40.
Summary Data AIA
Last price
75.40 HKD
Change 1 day / 5 days / 1 month
5.23% / 6.12% / 2.45%
Trend / MA-cross
sideways / none
SMA20 / SMA50
71.40 / 73.92
RSI (14) / Stochastic %K
60.0 / 99.1
Bollinger %B / ATR
108% / 1.83
Support / Resistance 20 days
68.80 / 75.40
Data as of
30 October 2026 15:08 WIB
Disclaimer: This technical analysis is generated automatically from exchange data and indicators calculated by JournalArta, for information and education only. The verdict and the entry, target and stop-loss levels are not investment advice or a solicitation to buy or sell any security. Investment decisions and their risks rest solely with the reader.