On October 29, 2026: price 275.20 USD, trend sideways, RSI 63.1, support 248.61, resistance 275.20. technical analysis of jnj stock.
By Alistair Sterling
October 30, 20264 min read
Advertisement
JNJ Testing Key Resistance
Johnson & Johnson climbed 1.53% to $275.20 in Thursday’s session, putting the healthcare group’s shares at the top of their recent trading range as investors weigh a strong price trend against signs that short-term momentum may be stretched. The stock is also in focus because JournalArta has not covered it in the past 14 days.
The move extended JNJ’s gains to 2.84% over five sessions and 6.39% over one month. But the advance came on below-average volume, while the price moved above the upper Bollinger Band—a measure of how far a share trades from its recent average. That combination signals strength, but does not by itself confirm that the rally has broad participation.
Advertisement
Trend & Price Action
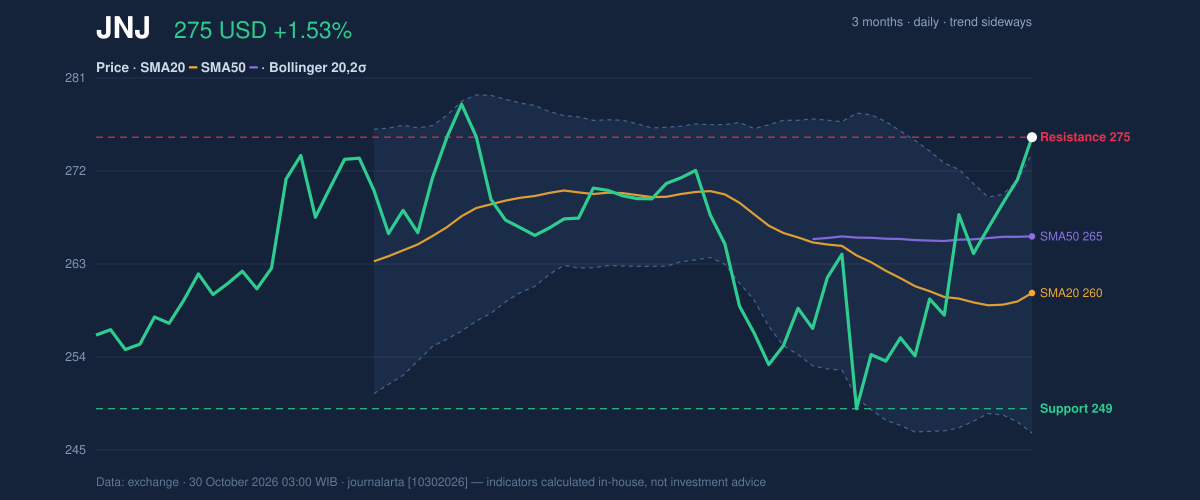
JNJ’s last price of $275.20 was above its 20-day moving average of $259.94 and its 50-day average of $265.48. The 20-day average rose 0.21% over five days, a modest slope that fits the data’s description of a sideways trend better than a decisive breakout. There was no new moving-average cross, so the averages offer no fresh signal that the longer-term trend has changed.
The shares closed at the stated 20-session resistance of $275.20, placing them at 100% of that range, and near the three-month high of $281.07. This is an important test: a move beyond the recent ceiling could extend the advance, but failure to hold near the top of the range would leave the rally vulnerable to a pullback toward established support.
The upper Bollinger Band stood at $273.66, below the latest price, while the band width was 10.6% and classified as normal. A reading above the upper band can accompany strong buying pressure, but it also means the price has moved beyond its recent statistical range. It is a caution about extension, not a forecast that a reversal must follow.
3-month price action chart of JNJ: price, SMA20/50, Bollinger, support & resistance.
Advertisement
Momentum & Participation
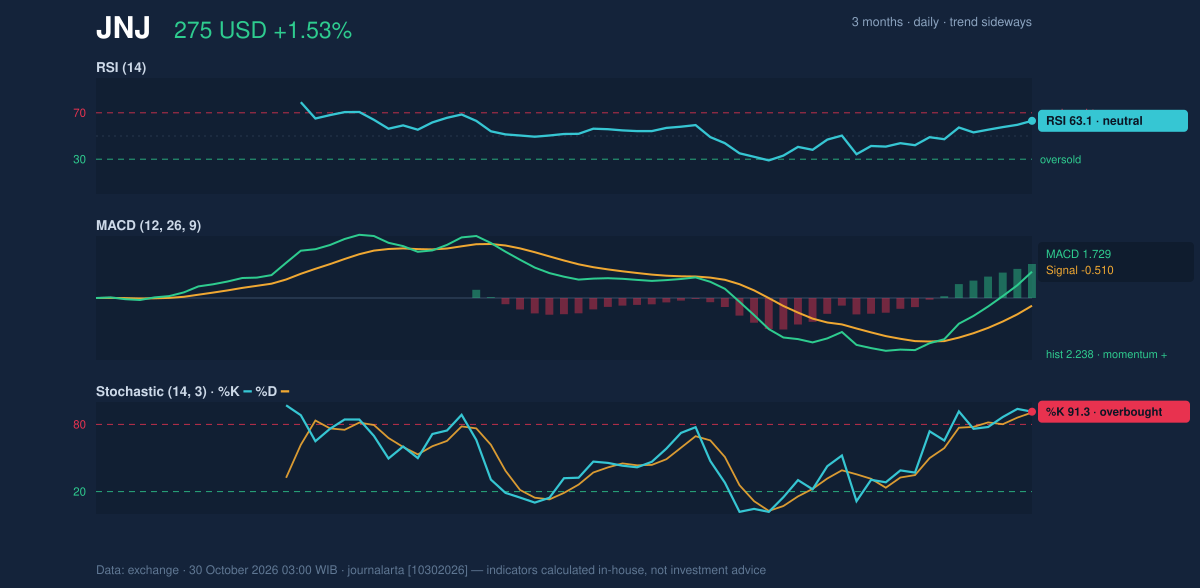
The momentum indicators are positive, though they do not tell exactly the same story. MACD was 1.729, above its signal line of -0.510, with a positive histogram of 2.238. In plain language, the short-term price trend remains stronger than its recent comparison baseline. RSI, at 63.1, was neutral: it points to firm momentum without reaching the data’s overbought classification.
Stochastic readings were more cautionary. %K at 91.3 and %D at 90.6 were in overbought territory, indicating that the price has advanced quickly relative to its recent trading range. This can persist during a strong move, but it leaves less room for error if buying pressure fades.
Momentum chart of JNJ: RSI(14), MACD, Stochastic.
Trading volume was 6,013,200 shares, about 0.8× the 20-session average of 7,721,015. That means the latest gain lacked the confirmation that heavier participation might provide. OBV, a measure that tracks whether volume is flowing more consistently into or out of a stock, was rising—an encouraging counterpoint, though not enough to erase the light-volume signal. ATR was $7.39, or 2.7% of the share price, indicating moderate day-to-day volatility.
Advertisement
Key Levels & Scenarios
The immediate reference is $275.20, both the latest close and the stated 20-session resistance. The next higher reference in the data is the three-month high at $281.07. A sustained move above the range ceiling would put that high in focus; failure to hold the breakout area would shift attention to the moving averages at $265.48 and $259.94.
Further down, the 20-session support is $248.61, with the three-month low at $245.17. Those levels define a deeper downside test if the shares retreat through their moving averages. The gap between the latest price and these references also underscores why a technically strong reading does not remove the risk of a pullback.
Technical Verdict: HOLD (wait & see)
The technical balance supports a wait-and-see verdict rather than a directional call. MACD remains positive and OBV is rising, but the price is above the upper Bollinger Band, Stochastic is overbought, and volume is below its 20-session average.
- Ideal Entry Range: $259.94–$265.48, defined by the 20-day and 50-day moving averages.
- Exit Target (Target Price): $281.07, the three-month high and next stated resistance reference.
- Stop Loss: $248.61, the 20-session support level.
- Invalidation: The verdict is invalidated if price falls below $248.61.
For non-traders, the indicators show a share price with positive momentum but stretched enough that its next move needs confirmation.
Disclaimer: This technical analysis is generated automatically from exchange data and indicators calculated by JournalArta, for information and education only. The verdict and the entry, target and stop-loss levels are not investment advice or a solicitation to buy or sell any security. Investment decisions and their risks rest solely with the reader.