COIN Stock Drops 1.07%, Death Cross Pressure In Focus
On October 29, 2026: price 160.59 USD, trend downtrend, RSI 40.0, support 159.60, resistance 188.22. technical analysis of coin stock.
By Elena Vance
October 30, 20264 min read
Advertisement
COIN Stock Drops 1.07%, Death Cross Pressure In Focus
Why COIN is in focus today
Fresh death cross: SMA20 crossed below SMA50
Downtrend extending (5-day change -5.03%)
Not covered by JournalArta in the last 14 days
Selected automatically from 32 NASDAQ (US) stocks by a technical-signal score with daily weighted randomisation — not a recommendation.
Coinbase shares fell 1.07% to $160.59 on the Nasdaq in Thursday’s session, October 29, as a death cross formed four sessions earlier reinforced a broader decline. The signal matters because the 20-day average has moved below the 50-day average, suggesting recent weakness is extending beyond a short-lived daily move. The stock also lost 5.03% over five days, while the 20-day average itself fell 4.00% over that span.
Advertisement
Trend & Price Action
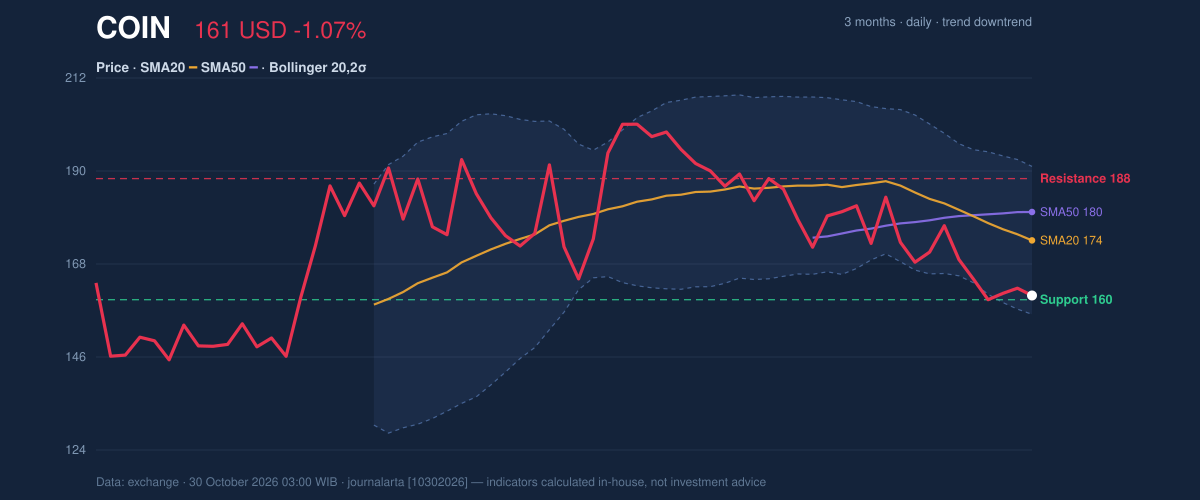
Coinbase is trading below both its 20-day simple moving average, or SMA, at $173.62 and its 50-day average at $180.32. The shorter average crossing below the longer one is known as a death cross; it is a measure of trend direction, not a guarantee that prices will keep falling. Here, the timing and the continued decline give the signal added weight.
The shares sit near the bottom of their 20-day range: the $159.60 support is about 3% below the latest price, while resistance is at $188.22. That leaves little room before the nearest stated support is tested. The stock remains within its three-month range of $139.11 to $208.33, so the recent weakness has not taken it to the period low.
The price is pressing toward $159.60 support while remaining well below both key moving averages. As shown in the chart, the price structure can be read alongside the moving averages, Bollinger bands and marked support and resistance.
3-month price action chart of COIN: price, SMA20/50, Bollinger, support & resistance.
Advertisement
Oscillators & Momentum
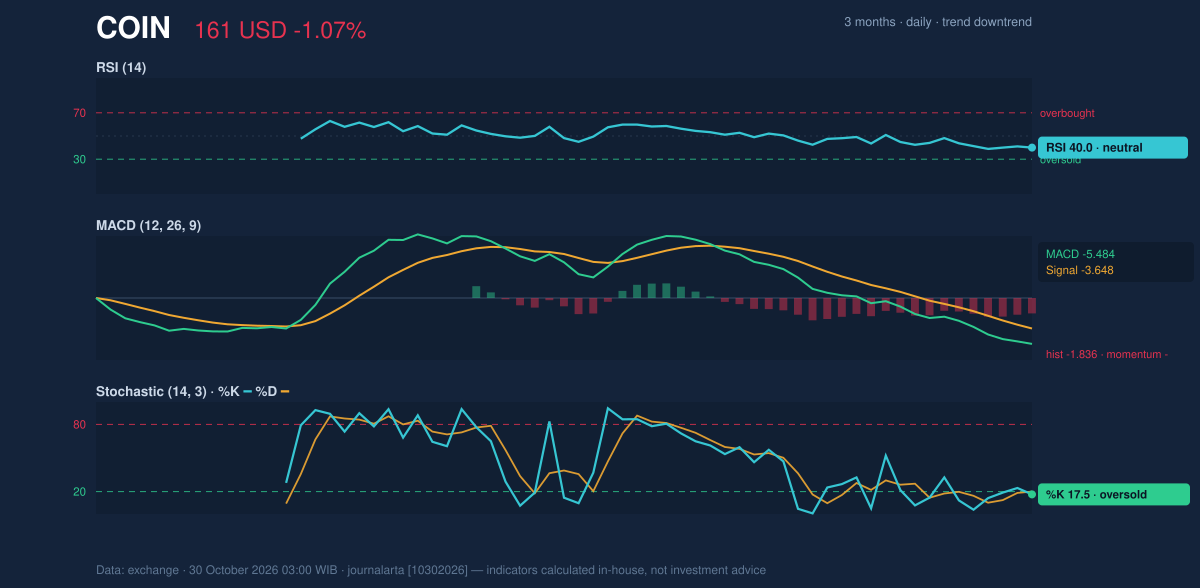
Momentum indicators are mixed, but the balance still leans negative. The 14-day Relative Strength Index (RSI), which gauges the pace of recent gains and losses, is 40.0 and classified as neutral. The Stochastic indicator is lower: %K is 17.5 and %D is 20.0, putting it in oversold territory. That can signal that selling has been intense, but it does not by itself confirm a rebound.
The Moving Average Convergence Divergence (MACD), an indicator comparing shorter- and longer-term price momentum, is below its signal line. Its reading is -5.484 against a signal of -3.648, with a histogram of -1.836. That negative MACD configuration confirms downside momentum rather than a clear turn higher. The oversold Stochastic reading therefore points to pressure that may be stretched, while MACD shows sellers still have the momentum advantage.
Momentum chart of COIN: RSI(14), MACD, Stochastic.
Volatility & Volume
The price is near the lower Bollinger band at $156.15, with %B at 13%. Bollinger bands map a typical price range around a moving average; a low %B places the price close to the lower boundary. The bands are widening, with a 20.1% width, indicating elevated volatility rather than a settled trading range.
The Average True Range (ATR), a measure of typical price movement, is $9.16, or 5.7% of the share price. That is high enough to make nearby levels consequential: moves can be sizeable even without a change in the longer-term trend. Volume was 8,269,000 shares, 1.1 times the 20-day average of 7,794,240, while On-Balance Volume (OBV) fell. The above-average turnover alongside declining OBV suggests selling pressure has not yet been matched by a convincing accumulation signal.
Advertisement
Key Levels & Scenarios
The immediate test is $159.60 support, with the lower Bollinger band at $156.15 nearby. A break below support would weaken the near-term structure; the three-month low is $139.11, but the data do not establish that level as the next support. On the upside, $173.62, the 20-day average, is the first notable barrier, followed by the 50-day average at $180.32 and resistance at $188.22. A recovery above those levels would be needed to challenge the current downtrend.
Technical Verdict: HOLD (wait & see)
The indicators support a cautious, wait-and-see technical reading rather than a confirmed reversal. The strongest reasons are the death cross formed four sessions before the latest session, negative MACD momentum, and falling OBV; the oversold Stochastic and proximity to support temper, but do not erase, those signals. The HOLD verdict is invalidated if price falls below $159.60 support.
- Ideal Entry Range: $156.15–$159.60, the lower Bollinger band to 20-day support.
- Exit Target (Target Price): $173.62, the 20-day average.
- Stop Loss protection: Below $156.15, the lower Bollinger band.
For non-traders, the chart shows continued weakness, but the nearby support and oversold reading leave the direction less certain at this level.
Disclaimer: This technical analysis is generated automatically from exchange data and indicators calculated by JournalArta, for information and education only. The verdict and the entry, target and stop-loss levels are not investment advice or a solicitation to buy or sell any security. Investment decisions and their risks rest solely with the reader.