ABNB Stock Technicals: Gains 0.24% on Thursday, Momentum Weakens
On October 29, 2026: price 166.45 USD, trend sideways, RSI 47.1, support 160.39, resistance 176.94. technical analysis of abnb stock.
By Elena Vance
October 30, 20264 min read
Advertisement
ABNB Stock Technicals
Why ABNB is in focus today
MACD histogram has just turned negative
Selected automatically from 32 NASDAQ (US) stocks by a technical-signal score with daily weighted randomisation — not a recommendation.
Airbnb’s MACD histogram has turned negative, putting the stock’s recent gain against a weakening short-term momentum signal. Shares closed at $166.45 on Thursday, October 29, up 0.24% in the session but down 5.30% over five days, according to the supplied market data. For international investors, the tension is between a modest one-month advance and evidence that demand for the shares has softened.
Trend & Price Action
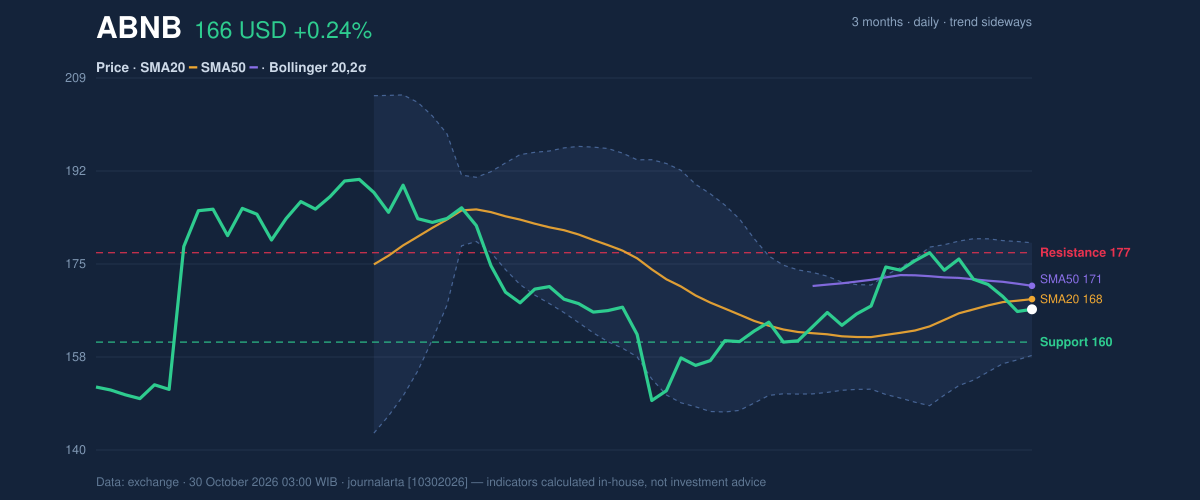
Airbnb is trading below both its 20-day moving average of $168.35 and its 50-day average of $170.80. The 20-day average rose 1.59% over five days, but the price has not followed it higher. That gap suggests the short-term trend is struggling to turn the average’s upward slope into a sustained price recovery. No new moving-average crossover has formed.
The stock is 37% of the way through its 20-session range, closer to support than resistance. Its position is not, by itself, evidence that a break lower is imminent; it does mean buyers have less room to let the price drift before testing a nearby floor. Over three months, Airbnb has traded between $148.65 and $193.45.
Support is $160.39; resistance is $176.94. The first level marks the recent range’s lower boundary, while the second is the upper boundary that shares would need to approach and clear to challenge the current weak structure.
3-month price action chart of ABNB: price, SMA20/50, Bollinger, support & resistance.
Advertisement
Oscillators & Momentum
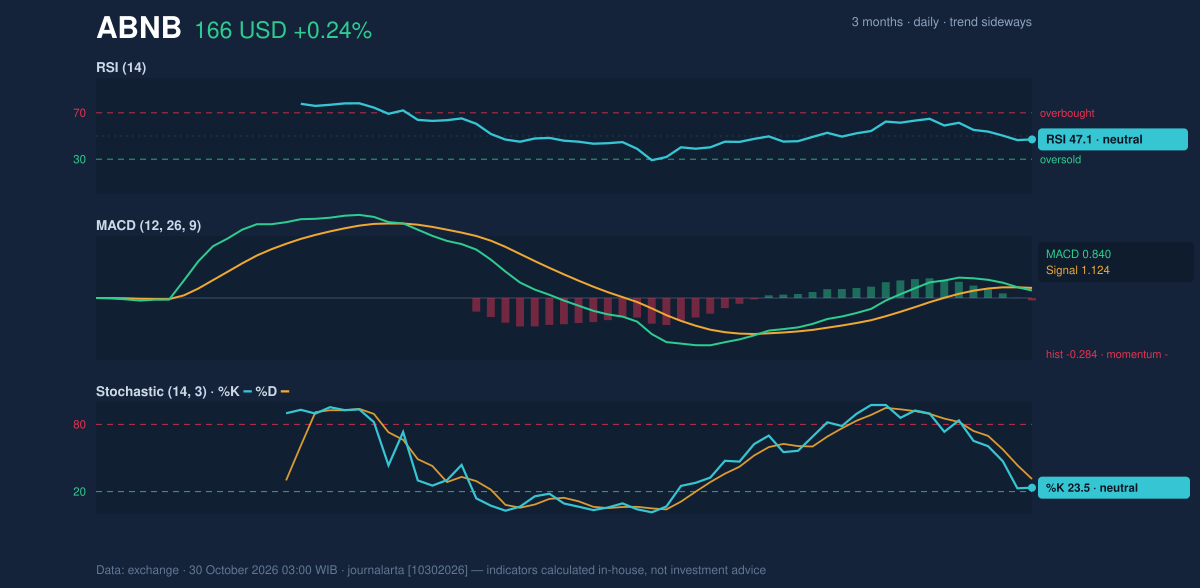
The MACD histogram has moved below zero to -0.284, with MACD at 0.840 beneath its 1.124 signal line. MACD compares two moving averages to gauge momentum; a negative histogram means the faster measure is lagging the signal line. It points to weakening short-term momentum, not a confirmed longer-term downtrend.
The MACD signal is negative, while RSI at 47.1 is neutral. RSI measures the speed of recent price changes; a reading near the midpoint offers no strong overbought or oversold warning. Stochastic %K at 23.5 and %D at 31.2 are also classed as neutral in the data, so they do not provide a clear reversal confirmation. The indicators therefore show softness without a strong consensus that the shares are either oversold or poised to rebound.
Momentum chart of ABNB: RSI(14), MACD, Stochastic.
Volatility & Volume
Airbnb’s Bollinger Bands run from $157.93 to $178.77, with the middle line at $168.35. These bands widen or narrow with recent price volatility; the reported 12.4% width is normal, not a squeeze that signals unusually compressed trading. The price sits at 41% of the band’s range, below its midpoint. The Bollinger position is below the middle band, but not near the lower boundary.
Average true range, a measure of typical daily movement, is $4.24, or 2.5% of the share price—moderate volatility. Volume was 2,557,500 shares, about 0.8 times its 20-session average of 3,208,835. OBV, which tracks whether volume tends to accompany rising or falling prices, is declining. Below-average volume and falling OBV do not confirm strong accumulation. The thin participation also cautions against treating a single session’s small gain as evidence that buyers have regained control.
Advertisement
Technical Verdict: HOLD
HOLD (wait & see) is the clearest technical reading of mixed signals, rather than a directional call. The price remains below both moving averages, MACD momentum is negative, and declining OBV with below-average volume points to limited buying confirmation. Against that, RSI and Stochastic are neutral, volatility is moderate, and the price remains above the $160.39 support level.
The verdict is invalidated if the price falls below $160.39, the stated 20-session support.
Ideal entry range: $160.39–$168.35, bounded by support and the 20-day average.
Exit target: $176.94, the 20-session resistance.
Stop-loss protection: below $157.93, the lower Bollinger Band.
For non-traders, the indicators show a stock with no clear directional confirmation, so the technical picture remains on hold.
Metric
Reading
Last price
$166.45
Daily / five-day / one-month change
+0.24% / -5.30% / +3.73%
SMA20 / SMA50
$168.35 / $170.80
RSI / Stochastic
47.1 / %K 23.5, %D 31.2
MACD histogram
-0.284
Support / resistance
$160.39 / $176.94
Advertisement
Summary Data ABNB
Last price
166.45 USD
Change 1 day / 5 days / 1 month
0.24% / -5.30% / 3.73%
Trend / MA-cross
sideways / none
SMA20 / SMA50
168.35 / 170.80
RSI (14) / Stochastic %K
47.1 / 23.5
Bollinger %B / ATR
41% / 4.24
Support / Resistance 20 days
160.39 / 176.94
Data as of
30 October 2026 03:00 WIB
Disclaimer: This technical analysis is generated automatically from exchange data and indicators calculated by JournalArta, for information and education only. The verdict and the entry, target and stop-loss levels are not investment advice or a solicitation to buy or sell any security. Investment decisions and their risks rest solely with the reader.