On October 28, 2026: price 43.18 USD, trend downtrend, RSI 40.5, support 41.65, resistance 46.35. technical analysis of vz stock.
By matthew jonathan
October 29, 20264 min read
Advertisement
VZ Stock Analysis
Verizon Communications fell 1.71% to $43.18 on the NYSE on Wednesday, October 28, 2026, extending its decline to 0.87% over five sessions and 5.86% over one month. The shares remain below their 20-day and 50-day moving averages, while mixed momentum signals and below-average trading volume suggest the latest weakness has not yet produced a clear reversal.
Trend & Price Action
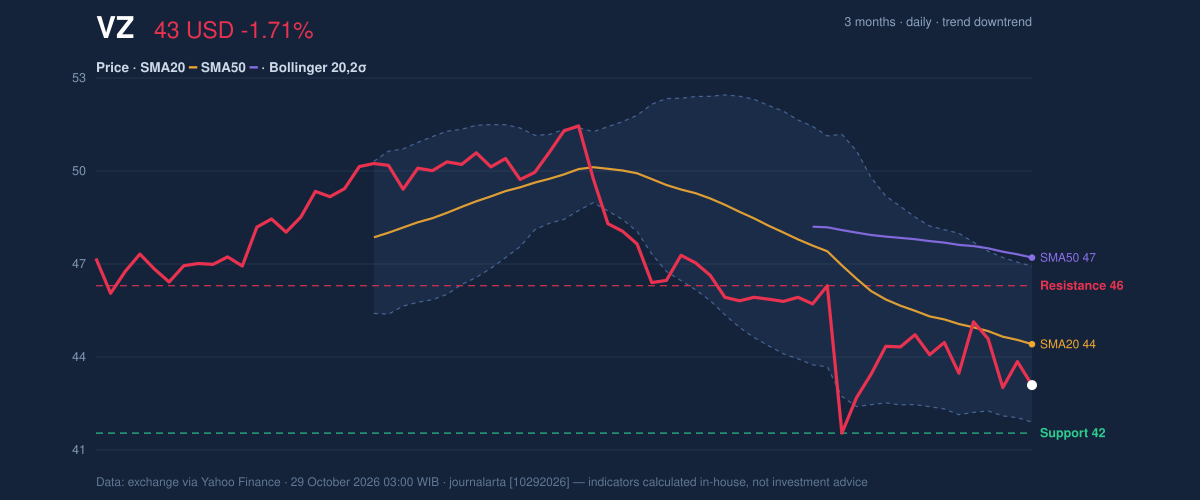
Verizon’s share price is below its 20-day average of $44.49 and its 50-day average of $47.25, a structure consistent with a downtrend. The 20-day average itself fell 1.42% over five days, indicating that near-term weakness is embedded in the trend rather than limited to a single session. No new moving-average crossover has formed.
The price sits in the lower third of its recent 20-session range, closer to support at $41.65 than resistance at $46.35. Its three-month low was $40.81 and high $51.67. That positioning leaves room for a test of nearby support, but a rebound would still need to clear the moving averages and resistance area to alter the technical picture.
3-month price action chart of VZ: price, SMA20/50, Bollinger, support & resistance. Data: exchange.
Advertisement
Oscillators & Momentum
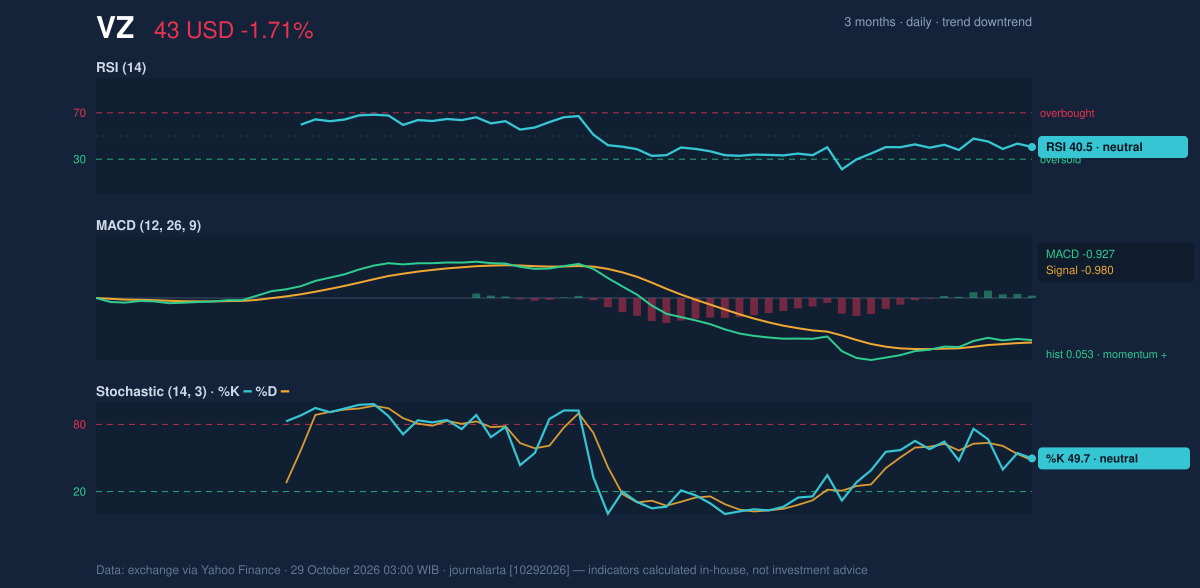
Momentum indicators are less negative than the price trend, but they do not yet establish a durable turn. The RSI is 40.5, in neutral territory: it is weak, but not at a level that signals an oversold condition. The Stochastic readings are also neutral, with %K at 49.7 and %D at 47.9, showing neither strong buying pressure nor a pronounced downside extreme.
The MACD offers a modest counterpoint. Its reading of -0.927 remains below zero, but it is above its -0.980 signal line, producing a positive histogram of 0.053. That combination points to improving short-term momentum within a still-negative broader trend; it is a tentative sign, not confirmation that the downtrend has ended.
Momentum chart of VZ: RSI(14), MACD, Stochastic. Data: exchange.
Volatility & Volume
Verizon trades at 24% of the way through its Bollinger band range, with the lower band at $42.00, the middle band at $44.49 and the upper band at $46.97. The low %B reading places the shares nearer the lower band, consistent with recent selling pressure. The 11.2% band width is classified as normal, so the bands do not indicate an unusually compressed setup or a sharp volatility expansion.
The 14-day average true range is $1.60, equivalent to 3.7% of the share price, pointing to high day-to-day volatility. The latest session’s volume was 25,377,700 shares, about 0.8 times the 20-session average of 30,252,120. Lower-than-usual participation means the decline came without a volume surge, but OBV—the running measure of buying and selling volume—also fell, providing no accumulation signal to offset the weak trend.
Advertisement
Key Levels & Scenarios
The first nearby test is the Bollinger lower band at $42.00, followed by 20-session support at $41.65. A break below support would put the three-month low of $40.81 back in view. Conversely, holding the support area and reclaiming $44.49 would be an initial sign of repair, though resistance at $46.35 and the upper band at $46.97 remain hurdles.
The technical balance still tilts downward because the price is below both moving averages and OBV is falling. The MACD’s positive histogram is the main counter-signal, but neutral RSI and Stochastic readings do not yet confirm a broader reversal.
Technical Verdict: HOLD
HOLD (wait & see) is the technical verdict: the downtrend and declining OBV argue for caution, while the MACD histogram’s positive reading and proximity to support make a decisive bearish signal less clear.
Ideal Entry Range: $42.00–$41.65, the lower Bollinger band to 20-session support.
Exit Target: $46.35, the 20-session resistance level.
Stop Loss: Below $41.65, using a break of 20-session support as the invalidation condition.
Advertisement
The verdict is invalidated if the price falls below $41.65. In plain English, the chart does not yet show enough evidence to call a reversal, so the next test of support matters.
Technical analysis describes market signals and is not an investment recommendation.
Summary Data VZ
Last price
43.18 USD
Change 1 day / 5 days / 1 month
-1.71% / -0.87% / -5.86%
Trend / MA-cross
downtrend / none
SMA20 / SMA50
44.49 / 47.25
RSI (14) / Stochastic %K
40.5 / 49.7
Bollinger %B / ATR
24% / 1.60
Support / Resistance 20 days
41.65 / 46.35
Data as of
29 October 2026 03:00 WIB
Disclaimer: This technical analysis is generated automatically from exchange data (via Yahoo Finance) and indicators calculated by JournalArta, for information and education only. The verdict and the entry, target and stop-loss levels are not investment advice or a solicitation to buy or sell any security. Investment decisions and their risks rest solely with the reader.