QCOM Stock Technicals: Gains 2.54% on Tuesday, Testing Key Resistance
On October 27, 2026: price 184.17 USD, trend sideways, RSI 56.3, support 172.11, resistance 184.87. technical analysis of qcom stock.
By matthew jonathan
October 28, 20264 min read
Advertisement
QCOM Stock Technicals
Why QCOM is in focus today
MACD histogram has just turned positive
Selected automatically from 32 NASDAQ (US) stocks by a technical-signal score with daily weighted randomisation — not a recommendation.
Qualcomm rose 2.54% to $184.17 on Nasdaq on Tuesday, October 27, as its MACD histogram turned positive, a shift that signals improving short-term momentum even while the broader trend remains sideways. Trading volume was 1.2 times its 20-session average and on-balance volume rose, suggesting the advance drew stronger participation rather than occurring on unusually thin trade.
Trend & Price Action
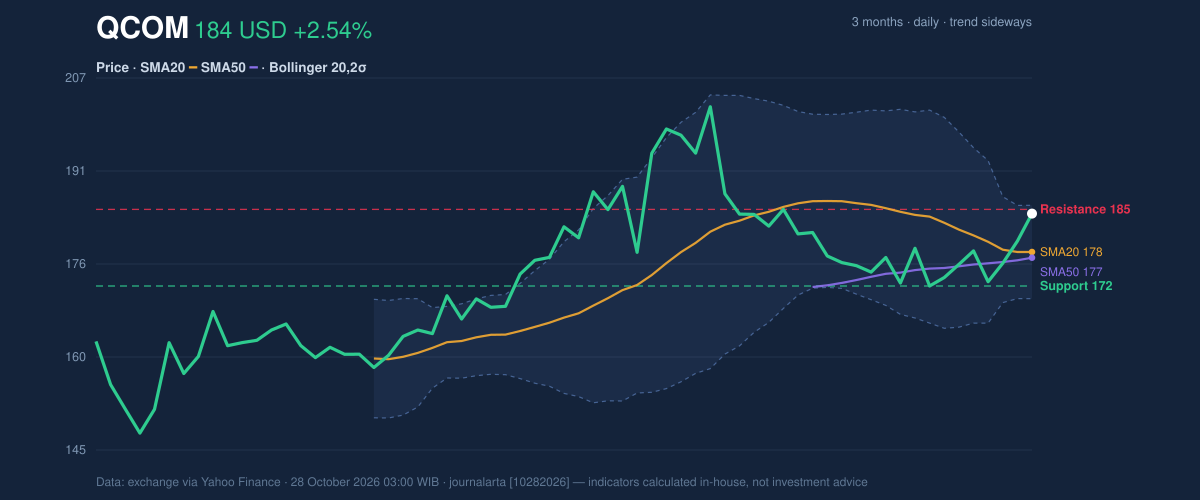
The session’s gain put Qualcomm above both its 20-day simple moving average, at $177.78, and its 50-day average, at $176.83. That is a constructive near-term position, but it does not yet establish a lasting trend: the 20-day average’s slope was negative, falling 2.05% over five days, and no new moving-average crossover had formed. In other words, price has recovered above key short-term reference points while the average itself still reflects recent weakness.
Qualcomm gained 4.81% over five days, but was up just 0.04% over one month, underscoring how sharply the recent move contrasts with the broader sideways pattern. At 95% of its 20-session range, the stock is close to the $184.87 resistance level. The three-month high of $205.85 and low of $142.89 provide wider context: the current price sits between them, not at an extreme for that period.
The price chart shows that near-resistance position alongside the moving averages and Bollinger bands.
3-month price action chart of QCOM: price, SMA20/50, Bollinger, support & resistance. Data: exchange.
Advertisement
Oscillators & Momentum
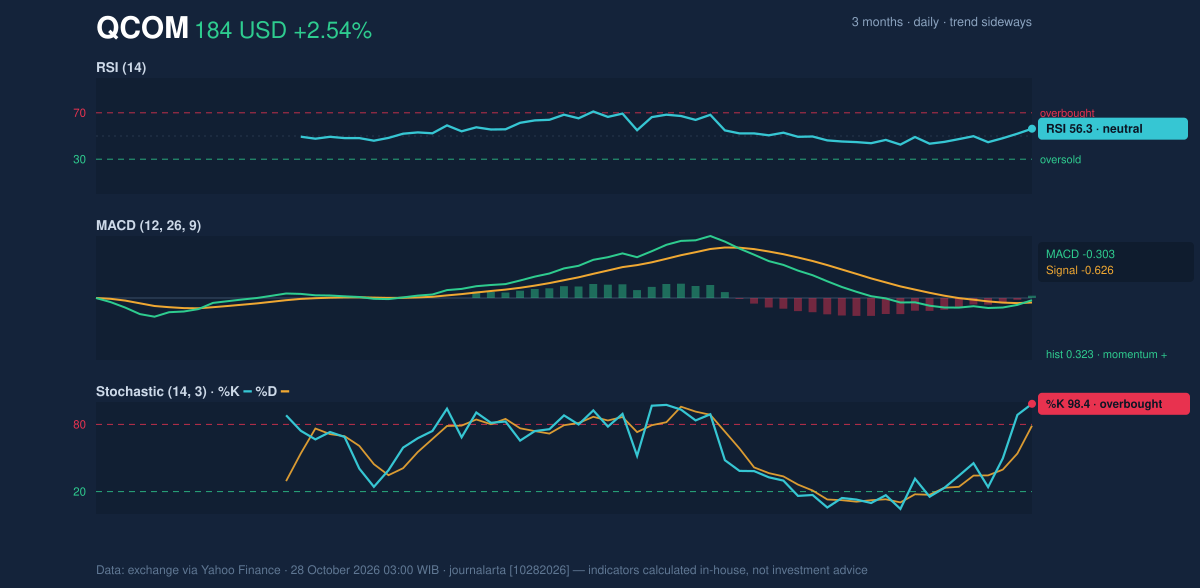
The MACD histogram turned positive at 0.323, with MACD at -0.303 above its signal line at -0.626. That configuration points to improving momentum: the MACD line remains below zero, so the signal is better read as a recovery in short-term force than as confirmation of a fully established bullish trend. It is the key reason this session is worth watching.
The RSI, at 56.3, remains neutral, consistent with a move that has gained traction without showing broad overbought conditions. Stochastic readings tell a more stretched story: %K at 98.4 and %D at 78.8 are overbought. This does not by itself predict a reversal, but it means the recent advance may be vulnerable to a pause, particularly as price approaches resistance.
The momentum chart puts the positive MACD shift beside the neutral RSI and elevated Stochastic readings.
Momentum chart of QCOM: RSI(14), MACD, Stochastic. Data: exchange.
Volatility, Volume & Levels
The Bollinger %B reading of 91% places price near the upper band, at $185.55, while the lower band is $170.01. The band width of 8.7% is normal rather than squeezed, so the data do not point to an unusually compressed market poised for a volatility release. Instead, price is pressing the upper part of its recent range. A close above $184.87 resistance would strengthen the case that buyers can extend the move; failure to hold above that area could leave the stock rotating back toward its moving averages.
Average true range, or ATR—a measure of typical daily price movement—was $6.06, equal to 3.3% of the share price, indicating moderate volatility. The combination of higher-than-average volume and rising OBV supports the advance, though it does not remove the risk implied by the overbought Stochastic reading.
The nearest support is $172.11, the 20-session level. The 20-day average at $177.78 and 50-day average at $176.83 sit between that support and the current price, making them nearer reference points if momentum fades. A sustained move through resistance would improve the price structure; a break below support would undermine it.
Advertisement
Technical Verdict: HOLD (wait & see)
The indicators present a mixed setup rather than a decisive trend. The positive MACD histogram and rising OBV support the recent advance, while the sideways trend and falling 20-day average temper that signal. Stochastic is overbought, and price is close to resistance.
- Indicative entry range: $176.83–$177.78, around the 50-day and 20-day averages.
- Indicative exit target: $184.87–$185.55, spanning resistance and the upper Bollinger band.
- Stop-loss reference: $172.11, the 20-session support.
- Invalidation: The verdict is invalidated if price falls below $172.11.
For non-traders, the indicators show improving momentum but not enough confirmation to resolve the sideways pattern.
The session’s volume was 12,267,900 shares, compared with a 20-session average of 9,884,280.
Summary Data QCOM
Last price
184.17 USD
Change 1 day / 5 days / 1 month
2.54% / 4.81% / 0.04%
Trend / MA-cross
sideways / none
SMA20 / SMA50
177.78 / 176.83
RSI (14) / Stochastic %K
56.3 / 98.4
Bollinger %B / ATR
91% / 6.06
Support / Resistance 20 days
172.11 / 184.87
Data as of
28 October 2026 03:00 WIB
Advertisement
Disclaimer: This technical analysis is generated automatically from exchange data (via Yahoo Finance) and indicators calculated by JournalArta, for information and education only. The verdict and the entry, target and stop-loss levels are not investment advice or a solicitation to buy or sell any security. Investment decisions and their risks rest solely with the reader.